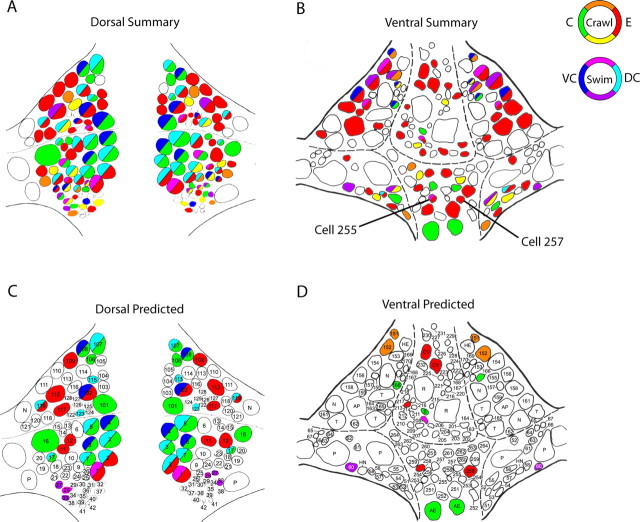
Figure 5.
Summary phase maps for swimming and crawling compared with predicted maps. A, A summary phase map obtained from experiments on the dorsal surface of eight different G10 ganglia (supplemental Figs. 1, 2, available at www.jneurosci.org as supplemental material). Cells included in this map were observed at the shown phase in at least four of eight experiments. The swimming and crawling phases have been merged; for cells active during both rhythms, the color on the left indicates the activity phase in swimming, and the color on the right indicates the phase in crawling. White cells were not in-phase with either oscillation, and mono-colored cells were active in-phase with only one of the oscillations. B, A summary phase map obtained from six experiments in which the ventral surfaces of six different G10 ganglia were imaged (supplemental Figs. 3, 4, available at www.jneurosci.org as supplemental material). Cells included in this phase map were observed in at least four of six experiments. C, D, The predicted merged phase maps for the dorsal (C) and ventral (D) surface based on the function of known neurons, including both motor neurons and interneurons. C, Contraction; E, elongation; DC, dorsal contraction; VC, ventral contraction.

