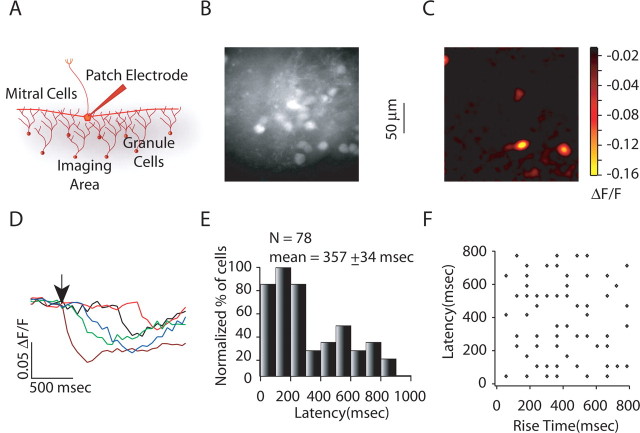
Figure 4.
Response latencies and duration of granule cell activity for single mitral cell stimulation. A, Experimental setup for imaging granule cell activity in response to single mitral cell stimulation. B, C, Raw fluorescence and ΔF/F image showing single mitral cell stimulation-evoked activity, respectively. D, Granule cell calcium transients for cells shown in C. The arrow depicts the time of stimulation. E, Granule cell activation latency histogram for glomerular stimulation (average latency, 357 ± 34 ms; n = 78), showing widely distributed activation latencies. F, Plot of granule cell response latencies versus granule cell rise time for glomerular stimulation. There was no correlation between granule cells activation latencies and granule cells rise time (r = 0.22).

