Figure 10.
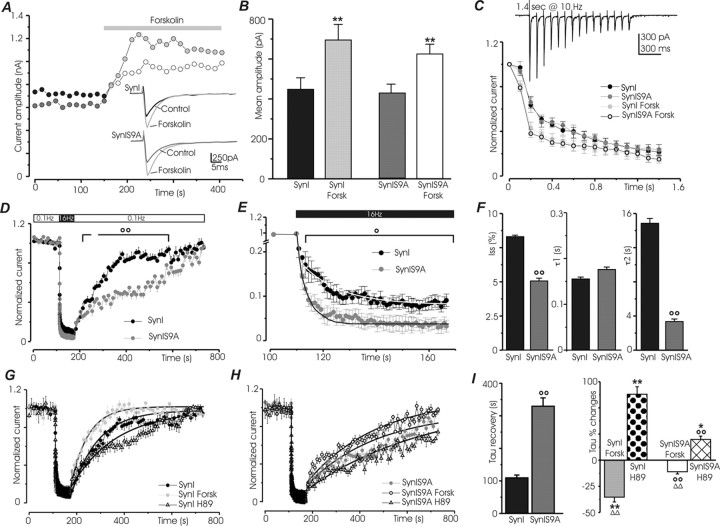
Mutation of phosphorylation site 1 in synapsin affects the kinetics of synaptic depression and recovery in response to sustained high-frequency stimulation and impairs the response to activation or inhibition of the PKA pathway. Recordings were performed on hippocampal neurons (9–15 DIV) from synapsin I knock-out mice expressing either ECFP–SynI or ECFP–SynI S9A, in the absence (control conditions) or presence of either forskolin (50 μm) or H89 (5 μm). Black bars, ECFP–SynI under control conditions; dark gray bars, ECFP–SynI S9A under control conditions; light gray bars, ECFP–SynI after forskolin; white bars, ECFP–SynI S9A after forskolin; dotted bars, ECFP–SynI after H89; dashed bars, ECFP–SynI S9A after H89. A, Representative traces of eEPSC amplitude versus time recorded during repeated presynaptic stimulation at 0.1 Hz in neurons expressing either wild-type or mutated synapsin I. Addition of 50 μm forskolin causes a clear increase in current amplitude in both neurons. Traces of single eEPSCs taken at 50 and 350 s are shown in the inset. B, Mean ± SE eEPSC amplitude of samples treated as in A (9 < n <13 cells for the various experimental groups). C, Plot of the 15 first eEPSCs evoked by a stimulation train at 10 Hz. The postsynaptic response is expressed as percentage of the first eEPSC of the train. A representative postsynaptic response evoked by the train is shown in the inset. Depression is increased by forskolin, but no significant differences are detected between the two groups of neurons (9 < n <11 cells for the various experimental groups). D, Plot of the normalized mean ± SE eEPSC amplitude (14 < n < 16 cells for the various experimental groups) recorded before, during, and after a 1 min pulse of stimulation at 16 Hz. The basal frequency of stimulation was 0.1 Hz. A clear difference in the rate of recovery from depression can be detected between neurons expressing wild-type or mutated synapsin I. In E, the time course of depression of the samples shown in D is shown on an expanded scale and fitted with a double-exponential decay function. For clarity, only every 15th point is shown. F, Mean ± SE values of eEPSC amplitude at steady state (Iss) and of the time constants of the fast (τ1) and slow (τ2) decay components of the samples in E. The slow component is strongly accelerated in neurons expressing synapsin S9A and accounts for 23 ± 0.5% of the total decay (vs 11 ± 0.2% in neurons expressing wild-type synapsin I). G, H, Effects of forskolin and H89 on the time courses of recovery from depression induced by the protocol described in D. Recovery curves were fitted according to a monoexponential function. I, The mean ± SE values (7 < n < 16 cells for the various experimental groups) of the time constants of recovery under basal conditions are shown in the left. In the right, the percentage ± SE changes in the time constants observed after treatment with forskolin or H89 with respect to the control values are shown. Forskolin markedly accelerates and H89 markedly slows down recovery in neurons expressing wild-type synapsin I. Both treatments had smaller effects in neurons expressing the mutated protein. Statistical analysis was performed by using two-way ANOVA, followed by the Duncan's multiple comparison test (*p < 0.05 and **p < 0.01 forskolin or H89 vs respective control; Δp < 0.05 and ΔΔp < 0.01 forskolin vs H89; °°p < 0.01 SynI S9A vs SynI).

