Figure 3.
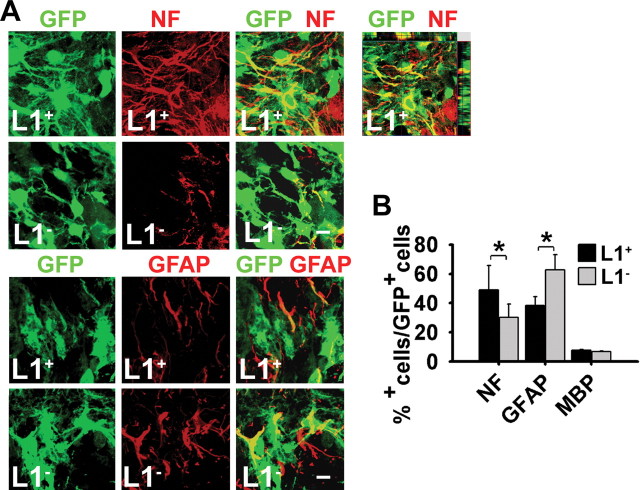
L1 + cells grafted into the quinolinic acid-lesioned striatum show increased neuronal differentiation. A, Laser-scanning microscopy illustrating immunohistochemical analysis of grafts of early stage 5 cells derived from L1 − and L1 + ES cells with the neuronal marker NF and the astrocytic marker GFAP (all in red) 4 weeks after transplantation of GFP + (green) cells. Donor-derived marker + cells in merged images appear yellow. NF staining of an L1 + graft with Z-series is displayed at top right. Note the increased expression of NF and the decreased expression of GFAP in L1 + grafts compared with L1 − grafts. Scale bar, 10 μm. B, Percentages of cell type-specific marker + cells in L1 + (n = 6) or L1 − (n = 6) grafts 4 weeks after transplantation (mean ± SEM). *p < 0.05 (Student's t test).

