
Figure 2.
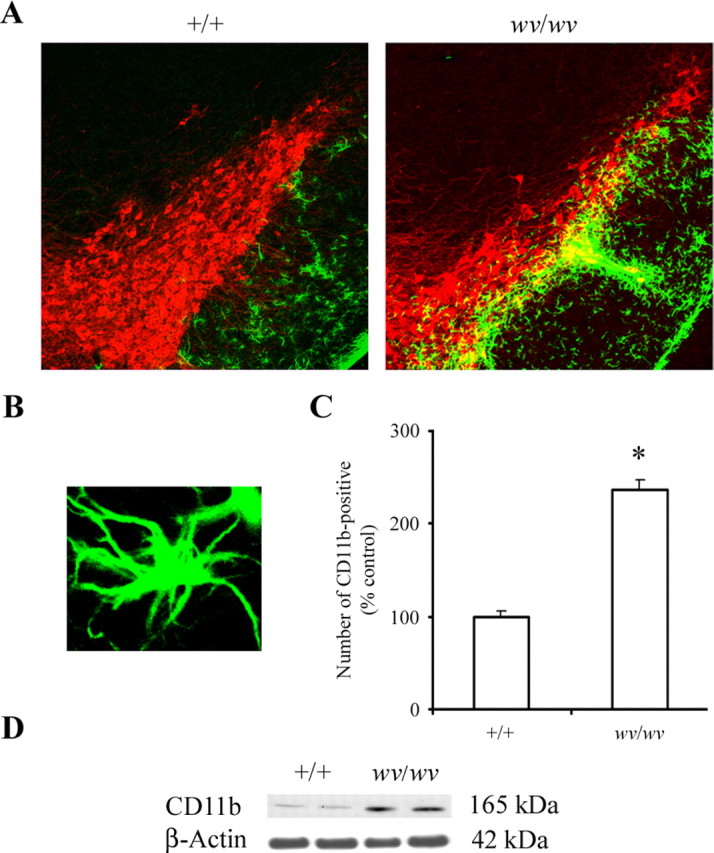
Microglial activation in the weaver SNpc. A, CD11b-positive microglia (green) and TH-positive neurons (red) in SNpc of +/+ and wv/wv mice. Original magnification, 10×. B, Photomicrograph of representative activated microglial cell in the wv/wv SNpc. Original magnification, 40×. C, Quantitative analysis of the number of activated microglia in +/+ versus wv/wv SNpc. Mean ± SEM, n = 6. *p < 0.001 wv/wv significantly different from +/+. C, Western blot analysis of CD11b protein levels in wv/wv and +/+ midbrain; β-actin was used as a loading control.