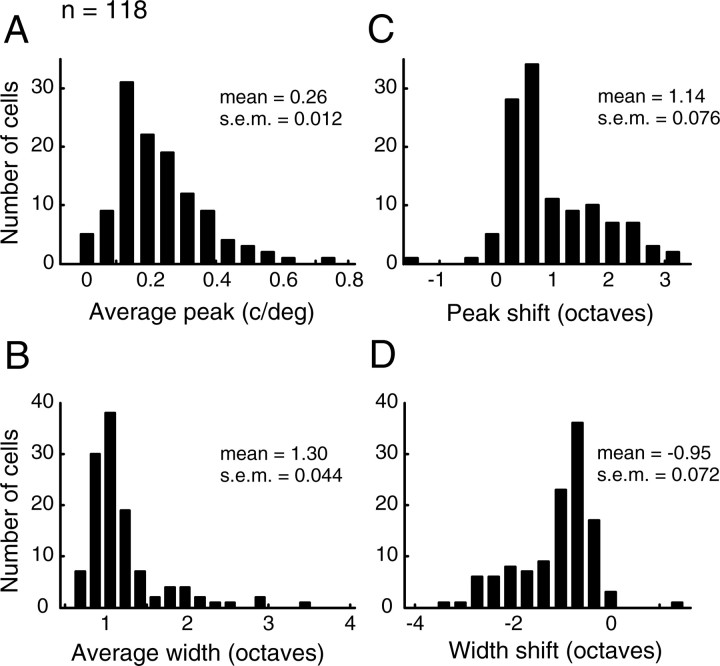
Figure 2.
Population distributions of predicted tuning parameters and parameter changes over time. A, B, Histograms of the peak SF (A) and half-width (B) for our sample of LGN neurons (n = 118). Average tuning parameters describe the tuning curve obtained by integrating the spectrotemporal map from tinitial to tfinal (∼30 ms). C, D, Distributions of changes in peak SF and tuning width. Peak shift is defined as log2[SFpeak(tfinal)/SFpeak(tinitial)], and the shift in width is bw(tfinal) − bw(tinitial). Both the mean of the peak shift (1.14 ± 0.076 octaves, mean ± SEM) and the mean of the width shift (−0.95 ± 0.072 octaves, mean ± SEM) were significantly different from zero (p ≈ 0 and p ≈ 0, two-tailed t test).

