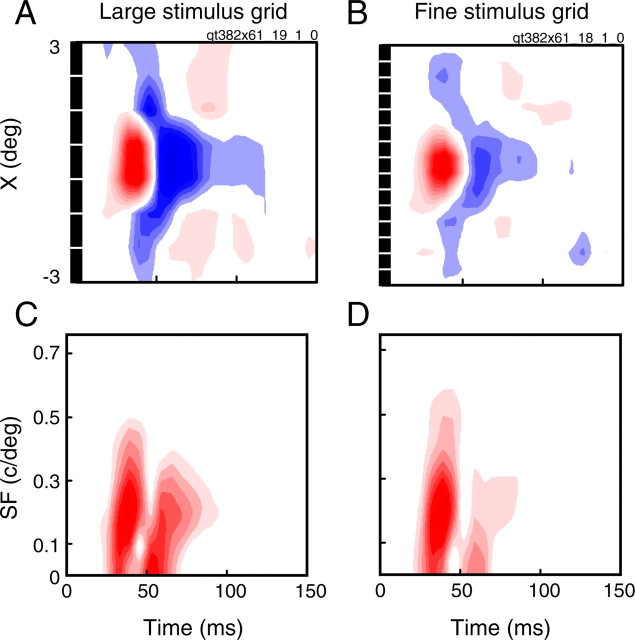
Figure 3.
Spatiotemporal RFs of a single neuron obtained with different stimulus grid sizes. A, C, The mapped spatiotemporal RF (A) and predicted spectrotemporal RF (C) obtained with an 8 × 8 stimulus grid. B, D, The mapped spatiotemporal RF (B) and predicted spectrotemporal RF (D) obtained with a 16 × 16 stimulus grid. Black boxes along the X dimension of the spatiotemporal RFs show the positions and sizes of each stimulus pixel. The stimuli used in A are too large to capture the full narrowing of the center component which is seen in B. This corresponds to a reduction in the high SF cutoff in the SF domain (compare C, D). However, the large stimuli are much more effective in eliciting a response from the surround.

