Figure 6.

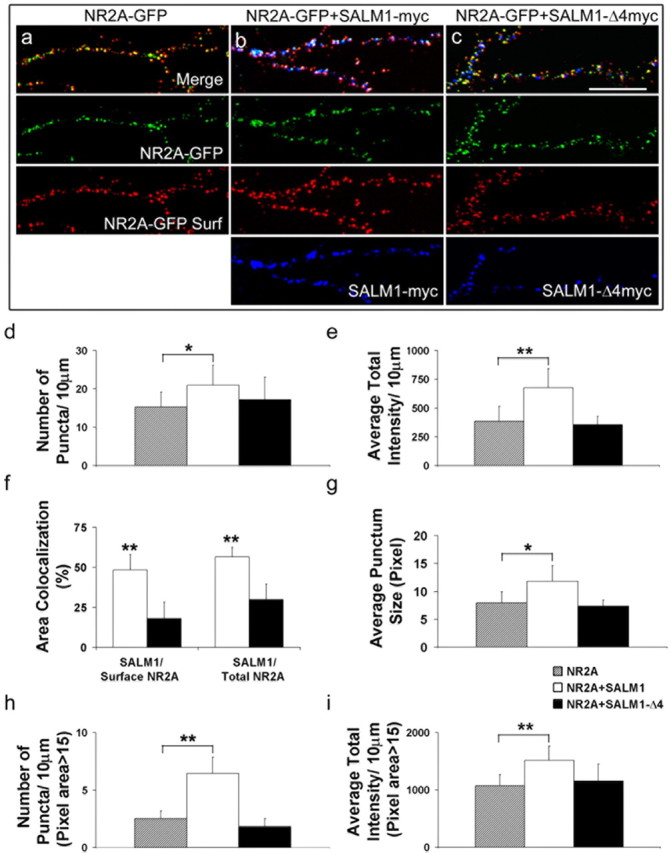
SALM1 recruits surface NMDA receptors through its interaction with PDZ proteins. Cultured hippocampal neurons at 14 DIV were cotransfected with NR2A-GFP and vector (a), NR2A-GFP and SALM1-myc (b), or NR2A-GFP and SALM1-Δ4myc (c). Cells were surface stained with anti-GFP (red) and permeabilized and stained with anti-myc (blue) for SALM1-myc or SALM1-Δ4myc. The expression of NR2A-GFP is shown in green. The level of surface fluorescence was analyzed with MetaMorph software. The number of puncta for NR2A-GFP surface staining (d), the average total intensity of NR2A-GFP surface staining (e), the percentage of area of colocalization for SALM1 and NR2A-GFP surface and NR2A-GFP total (f), and the average punctum size of NR2A-GFP surface staining (g) were analyzed. In addition, the number of puncta (h) and the average total intensity (i) of NR2A-GFP surface staining with the pixel area >15 were analyzed. The number of puncta/10 μm is 15.3 ± 3.9, 20.9 ± 5.3, and 17.2 ± 5.9 for cells transfected with NR2A alone, NR2A/SALM1, and NR2A/SALM1Δ4, respectively (d). The average total intensity is 386.3 ± 129.1, 675.8 ± 165.9, and 355.8 ± 71.7 units for cells transfected with NR2A alone, NR2A/SALM1, and NR2A/SALM1Δ4, respectively (e). The area of colocalization for SALM1 and NR2A surface is 48.4 ± 9.6% and of NR2A total is 56.5 ± 10.4%. The area of colocalization for SALM1-Δ4myc and NR2A surface is 18.0 ± 6.0% and for NR2A total is 29.9 ± 10.4% (f). The average punctum size is 7.9 ± 2.0, 11.8 ± 2.8, and 7.3 ± 1.1 pixels for cells transfected with NR2A alone, NR2A/SALM1, and NR2A/SALM1Δ4, respectively (g). For pixel areas larger than 15, the number of puncta for NR2A-GFP, NR2A-GFP/SALM1-myc, and NR2A-GFP/SALM1-Δ4myc is 2.5 ± 0.7, 6.5 ± 1.4, and 1.8 ± 0.7, respectively (h); the average total intensity for NR2A-GFP, NR2A-GFP/SALM1-myc, and NR2A-GFP/SALM1-Δ4myc is 1077.7 ± 190.3, 1516.0 ± 244.1, and 1155.5 ± 295.0, respectively (i). The area of colocalization is defined as the percentage of SALM1-myc or SALM1-Δ4myc that has NR2A-GFP surface staining or NR2A-GFP total expression. *p < 0.01; **p < 0.001. Scale bar, 10 μm. Results presented in d, e, and g–i are based on n = 23, 20, and 12 for NR2A, NR2A plus SALM1, and NR2A plus SALM1-Δ4, respectively, and in f on n = 18 and 12 for surface and total NR2A, respectively; values are mean ± SD.
