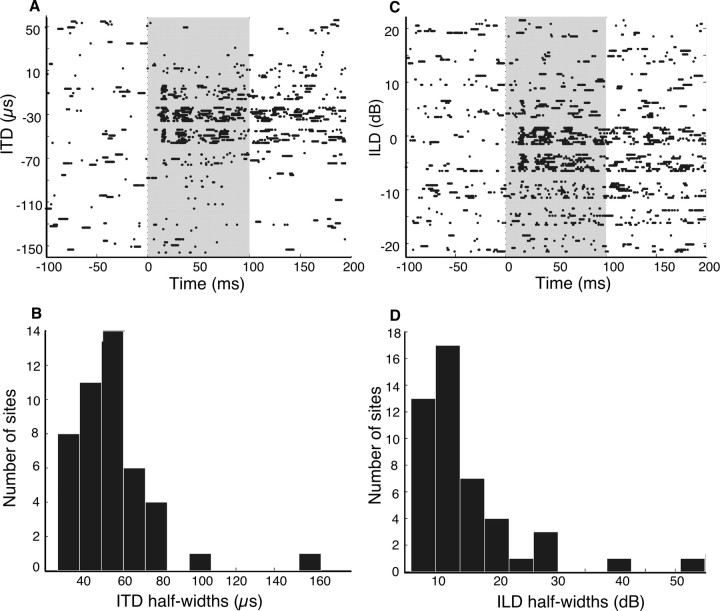
Figure 6.
Ipc sites have restricted auditory RFs. A, C, Raster plots of the response of an Ipc site to the binaural auditory localization cues ITD (A) and ILD (C). This site is from the same penetration as the site displayed in Figure 5. A negative ITD indicates left ear leading, and a negative ILD indicates left ear greater. B, D, Histograms of the half-width of tuning to ITD (B) or ILD (D) for all sites measured.

