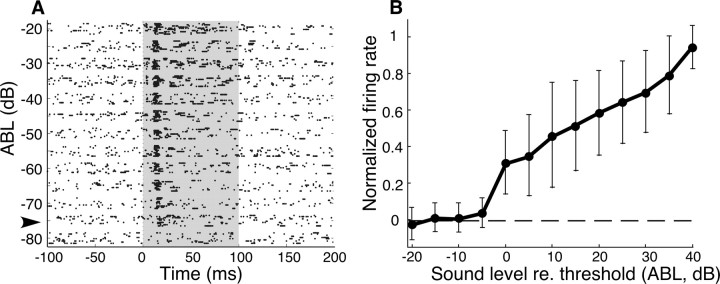
Figure 7.
Response strength increases with sound level. A, Raster plot of responses of an Ipc site to increasing sound level at its best ITD and ILD. Sound level is represented on the ordinate [average binaural level (ABL)]. Greater ABL values indicate increasing sound level. The response threshold was defined as the lowest sound level that elicited a response >1.5 SDs from the mean prestimulus firing rate. The arrowhead indicates the response threshold for this site. B, Responses to increases in ABL for all sites measured. The ordinate displays normalized firing rate (poststimulus response with average baseline firing rate subtracted, normalized to the maximum firing rate for that site). The abscissa displays sound level relative to response threshold. Error bars are SD.

