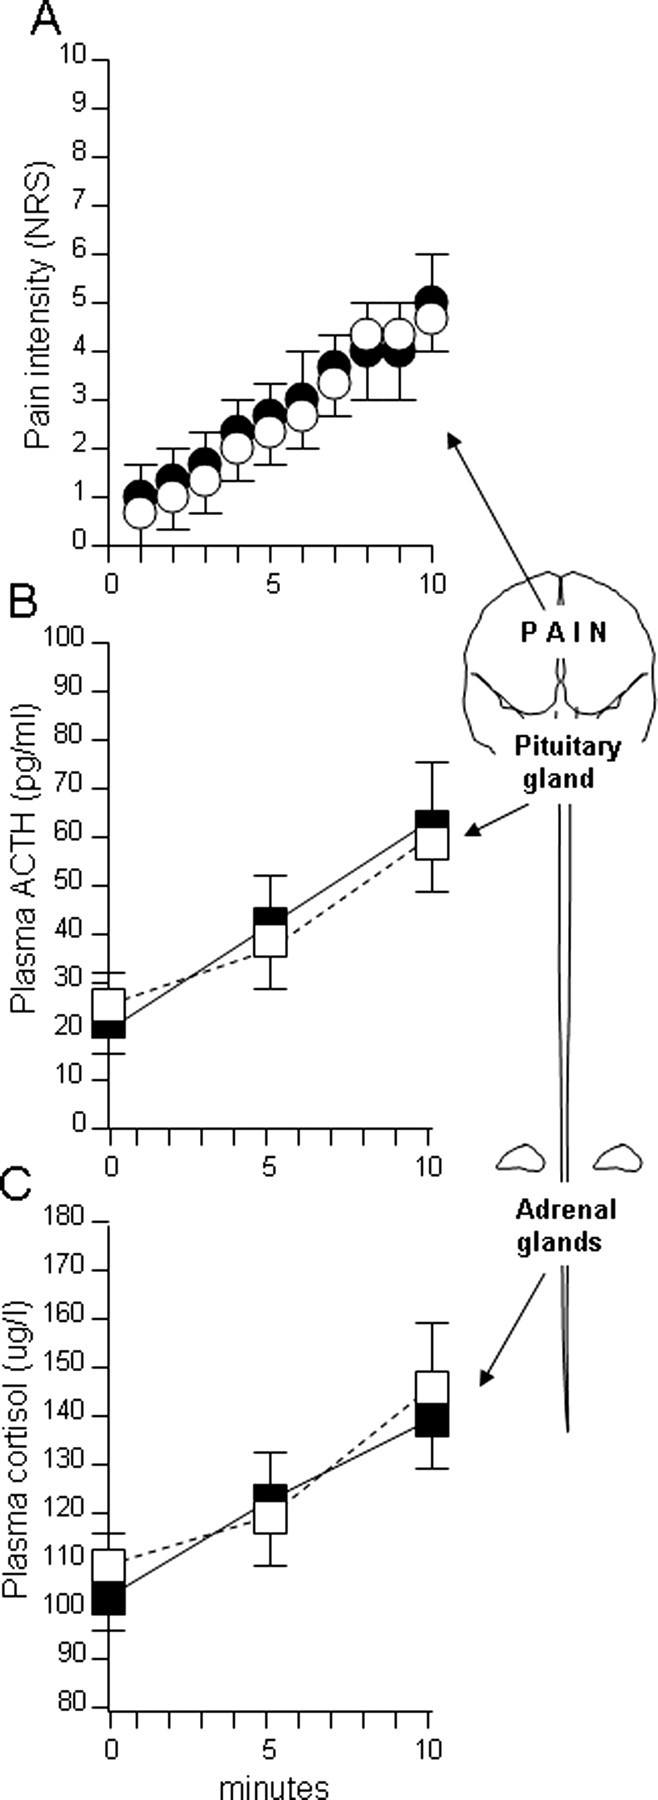
Figure 2.

The natural history of pain (A), ACTH (B), and cortisol (C) in test 1 (black symbols) is compared with the natural history of test 2 (white symbols). Note that no difference was present between tests 1 and 2, indicating stable conditions of our experimental setup.
