Figure 11.
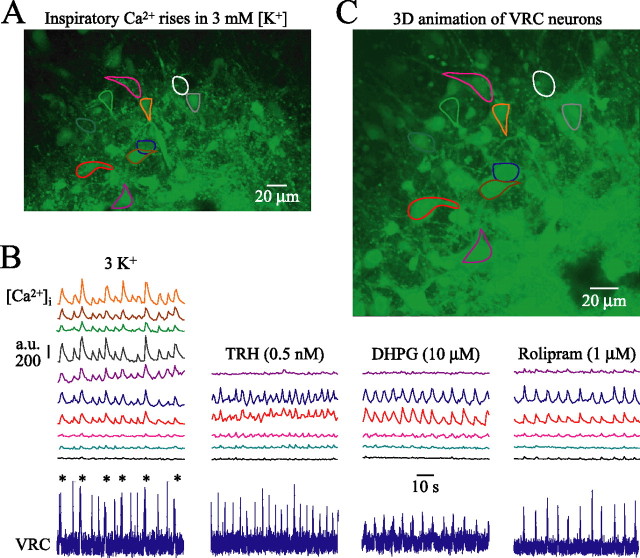
Confocal imaging of activity and morphology of inspiratory VRC neurons. A, Cells in the VRC region of mPBC[500/−0.75] W-P3 slice stained after pressure injection with the Ca2+-sensitive dye fluo-4-AM. Cells showing inspiratory-related increases of fluo-4 fluorescence, outlined as regions of interest, were located at a depth of 30 μm (i.e., −0.72 mm caudal to VIIc). B, Eighty second simultaneous recordings in 3 mm [K+] of rhythmic Ca2+ oscillations plotted as fluorescence intensity in arbitrary units (a.u.) in identified VRC neurons in A and electrophysiological population activity in the contralateral VRC (bottom trace). Note that fluorescence increases were consistently larger during intermingled (I-bursts; asterisk) compared with single (S)-bursts (see supplemental movie, available at www.jneurosci.org as supplemental material; compare Figs. 5, 6). After washout of rhythm in 3 mm [K+], VRC bursting and Ca2+ oscillations were consecutively reactivated by TRH, DHPG, or rolipram. Note that cells represented by the top four traces in the left panel were not monitored during drug application because of a minor shift in focal plane over time. C, 3D animation (supplemental material, available at www.jneurosci.org) showing gross morphology of VRC inspiratory neurons and nonrhythmic cells obtained from z-stack (0.5 μm single step) image series encompassing areas starting 7.5 μm above to 7.5 μm below the image plane of A.

