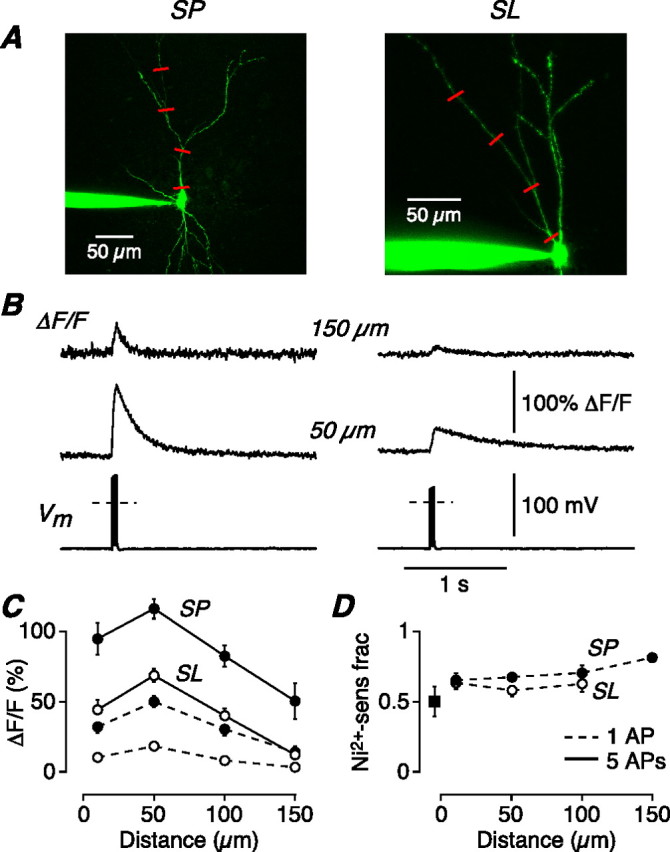
Figure 3.

AP-evoked Ni2+-sensitive calcium influx is greater in SP cells than in SL cells, suggesting a mechanism for the greater burst firing in SP cells. A, z-stack of an SP cell (left) and an SL cell (right) filled with 200 μm OGB-1. Line scans were done at the indicated locations on the apical dendrite (red lines). B, Normalized changes in OGB-1 fluorescence (ΔF/F) in response to a 100 Hz train of five APs elicited by current steps at the soma (Vm), recorded at 50 and 150 μm from the soma in an SP (left) and SL cell (right). Each line scan is an average of three to four sweeps. The dashed line in the Vm trace indicates 0 mV. C, Mean ΔF/F for SP cells (n = 7–20; filled circles) and SL cells (n = 12–33; open circles), plotted against distance along the apical dendrite from the soma. The continuous lines connect points measured using trains of five APs as in B; the dashed lines connect points measured with single AP stimuli. D, Mean fraction of ΔF/F that is sensitive to bath perfusion of 100 μm Ni2+, plotted against apical distance from the soma (SP, n = 3–8; SL, n = 5–14). The data shown are for single-AP stimuli; similar results were obtained with trains of five APs. The filled square shows the Ni2+-sensitive fraction measured in a basal dendrite of SP cells, 50 μm from the soma. Error bars indicate SEM.
