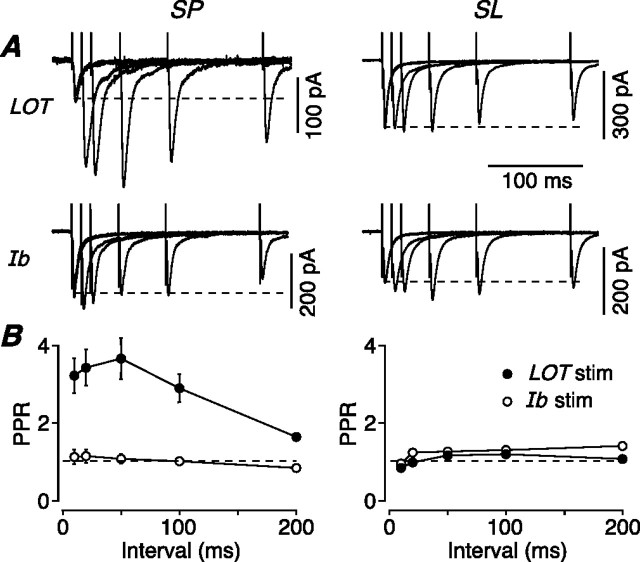
Figure 4.
Excitatory synaptic inputs from the LOT onto SP cells are unique in showing strong paired-pulse facilitation. A, Typical EPSCs recorded from a voltage-clamped SP (left) or SL cell (right) after paired-pulse extracellular stimulation of either the LOT (top) or layer Ib (bottom). Each panel shows five superimposed sweeps (each an average of 5) with a range of interpulse intervals. B, Mean PPR plotted against interstimulus interval for SP cells (left, n = 12 for LOT input, n = 6 for Ib input) and SL cells (right, n = 14 for LOT input, n = 5 for Ib input), after either LOT (filled circles) or Ib stimulation (open circles). Error bars indicate SEM.

