Figure 8.
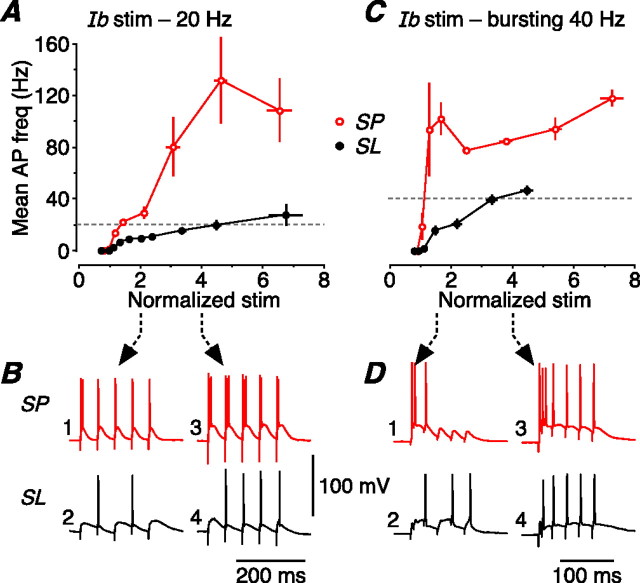
Responses of SP and SL cells to two other patterns of naturalistic layer Ib (Assn) stimulation (20 Hz, and bursting 40 Hz). These stimulus patterns were taken from the responses of both cell types to regular 40 Hz stimulation of the LOT (Fig. 7). A, Mean AP firing frequencies of SP cells (red; n = 4) and SL cells (black; n = 5) in response to a 20 Hz train of stimuli applied to layer Ib, representing the typical output of SL cells with weaker 40 Hz LOT stimulation (Fig. 7B, trace 2). The data were normalized as in Figure 7. Error bars indicate SEM. B, Illustrative postsynaptic responses to 20 Hz layer Ib stimulation, measured in an SP cell (top; red) and an SL cell (bottom; black) at either twice (left) or four times (right) the stimulus threshold for firing an action potential. C, Averaged data for the same experiment done with a bursting 40 Hz stimulus applied to layer Ib (SP, n = 5; SL, n = 4). This stimulus, representing the averaged (n = 10) output of SP cells with stronger 40 Hz LOT stimulation (Fig. 7B, trace 3), comprised two initial stimuli at an interval of 6 ms (166 Hz) followed by four stimuli at 40 Hz. D, Illustrative postsynaptic responses to this bursting 40 Hz layer Ib stimulation, displayed as in B except that here traces 1 and 2 show the result of stimulation at 1.5 times the AP threshold (not twice threshold, as in B).

