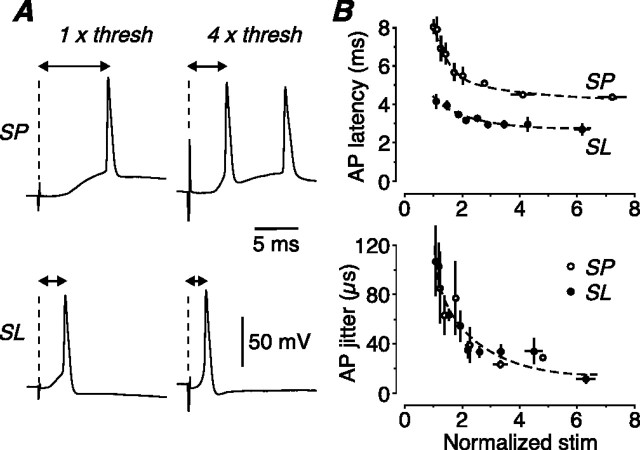
Figure 9.
Latency and jitter responses of SP and SL cells to a naturalistic stimulus. A, Examples of the first AP generated by a five pulse, 40 Hz train of LOT stimuli, recorded in an SP cell (top) and an SL cell (bottom) at threshold (left) or four times threshold (right) for firing one AP. The synaptic latency becomes smaller in both cells at the higher stimulus strength but is always briefer in the SL cell. B, Mean latency from the stimulus artifact to the peak of the AP (top), and mean jitter in AP timing (bottom), both plotted against normalized stimulus strength, using LOT stimulation (SP, open circles, n = 6; SL, filled circles, n = 6). Latency is consistently briefer in SL cells, but jitter is not significantly different between the two cell types. Error bars indicate SEM. Similar results were obtained for layer Ib (Assn) stimulation (data not illustrated).

