
Figure 1.
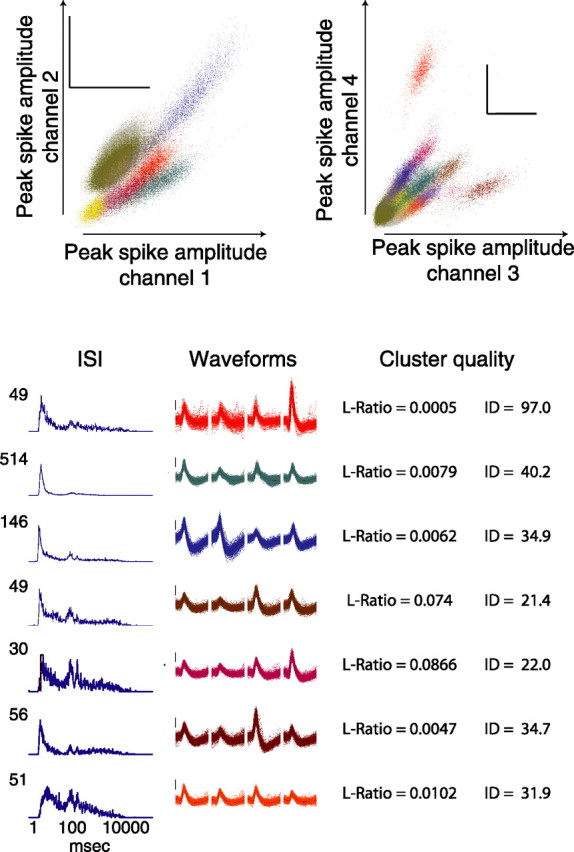
Example tetrode recordings: clustering, waveforms, and firing patterns. Spikes were clustered according to multiple waveform features including peak spike amplitude, energy, and principal components. Clustered spikes are shown with different colors for each cluster on two projections: peak spike amplitude on channel 1 versus channel 2, and peak amplitude on channel 3 versus channel 4. One millisecond waveforms for 7 of the 16 separable clusters are shown below color-coded by cluster color. ISI histograms from each neuron are typical of hippocampal pyramidal neurons. Calibration, 100 μV. ID, Isolation distance.