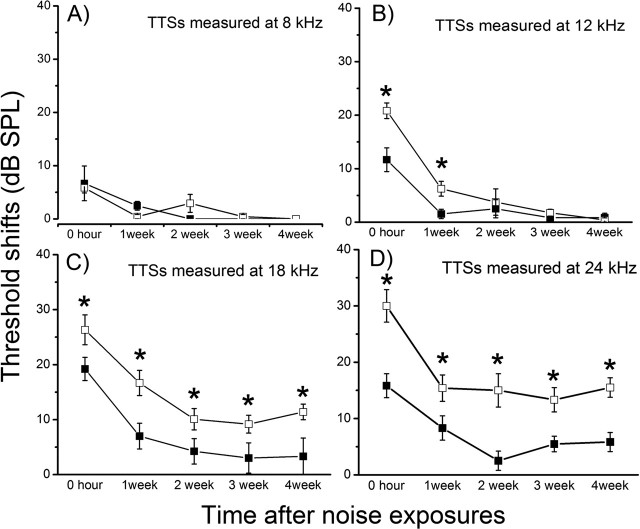
Figure 6.
Hearing threshold shifts after noise exposures measured at 4 (A), 8 (B), 18 (C), and 24 (D) kHz. Data from wild-type and Cx29KO mice are represented by open and filled squares, respectively. The threshold changes were followed for 4 weeks by ABR measurements after noise exposures. Error bars indicate SE.

