
Figure 4.
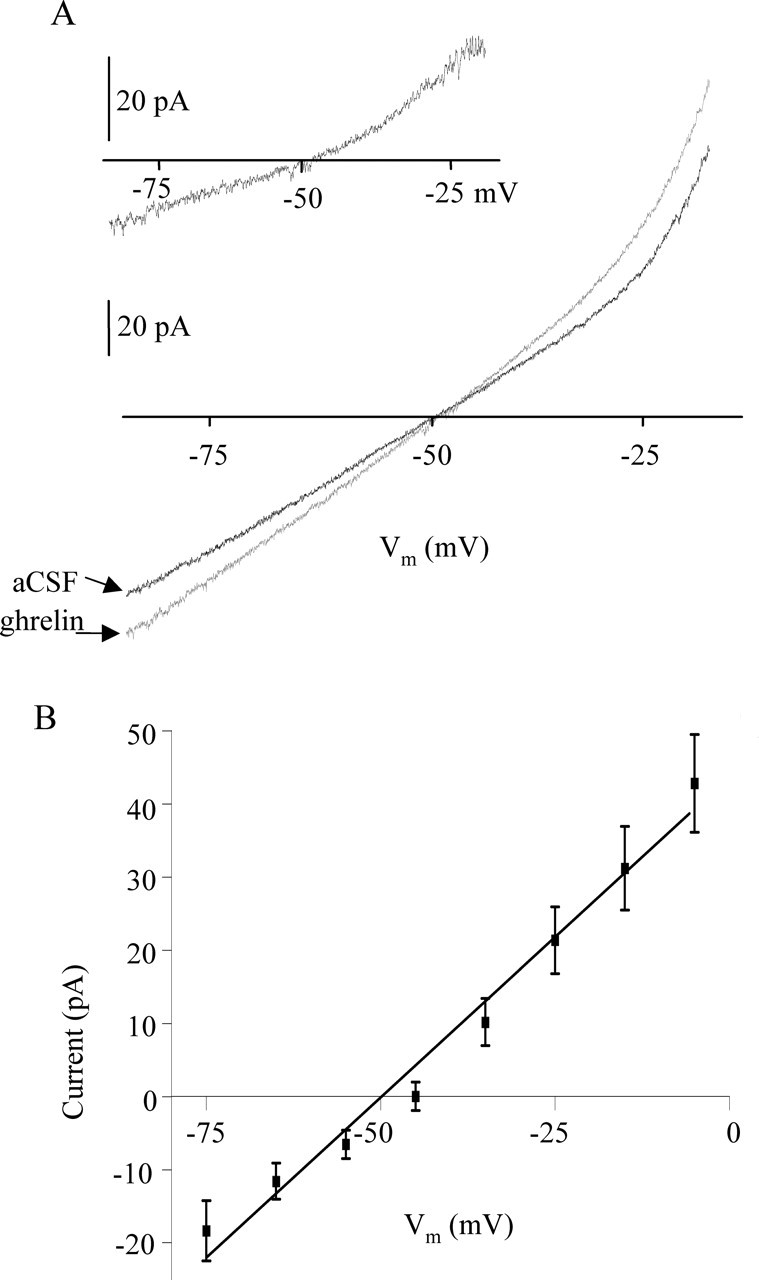
Ghrelin activates a nonselective cationic conductance. A, Graph represents the current recorded in a single cell during voltage ramps from −100 to −30 mV (each trace is a mean of 5 ramps) in the presence of ACSF (black) and 10 nm ghrelin (red). The inset represents the difference current calculated by subtracting the ghrelin-induced current from the control current (ACSF) in the same cell. B, Graph represents the mean (±SEM) difference current measured in nine responding cells.