
Figure 6.
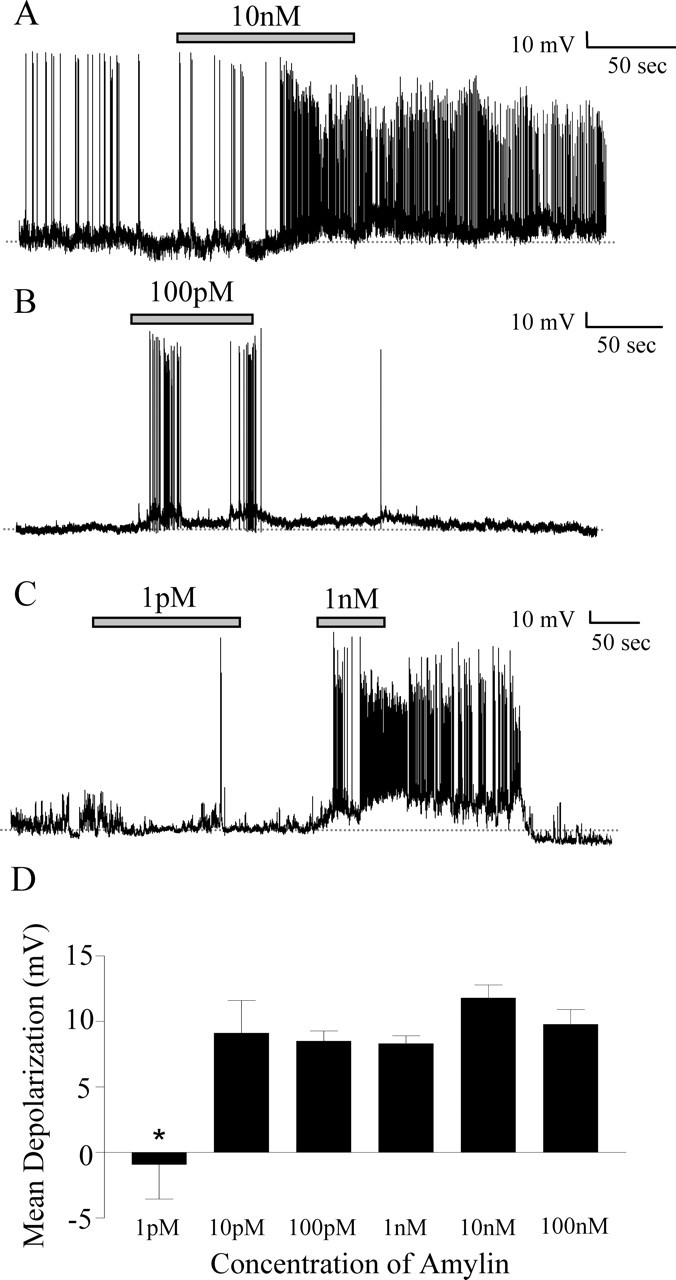
Effects of amylin are observed at different concentrations. A, Current-clamp recording showing a sustained depolarization in response to 10 nm amylin (gray bar). B, Current-clamp recording showing a response to 100 pm amylin (gray bar) that is smaller in magnitude than that seen at 10 nm (A). C, Current-clamp recording showing no change in membrane potential in response to 1 pm amylin (gray bar) and a subsequent reversible depolarization in response to 1 nm amylin (gray bar). D, The mean membrane potential changes in response to concentrations of amylin ranging from 100 nm to 1 pm. There was a significant difference between the mean depolarization at 1 pm and all other doses (*p < 0.05); however, there were no significant differences between doses ranging from 10 pm to 100 nm.