In the article “Energy Inhibition Elevates β-Secretase Levels and Activity and Is Potentially Amyloidogenic in APP Transgenic Mice: Possible Early Events in Alzheimer’s Disease Pathogenesis,” by Rodney A. Velliquette, Tracy O’Connor, and Robert Vassar, which appeared on pages 10874–10883 of the November 23, 2005 issue, a low-resolution version of Figures 3, 4, and 5 was used in the printed issue. These figures and their legends are reprinted in this issue.
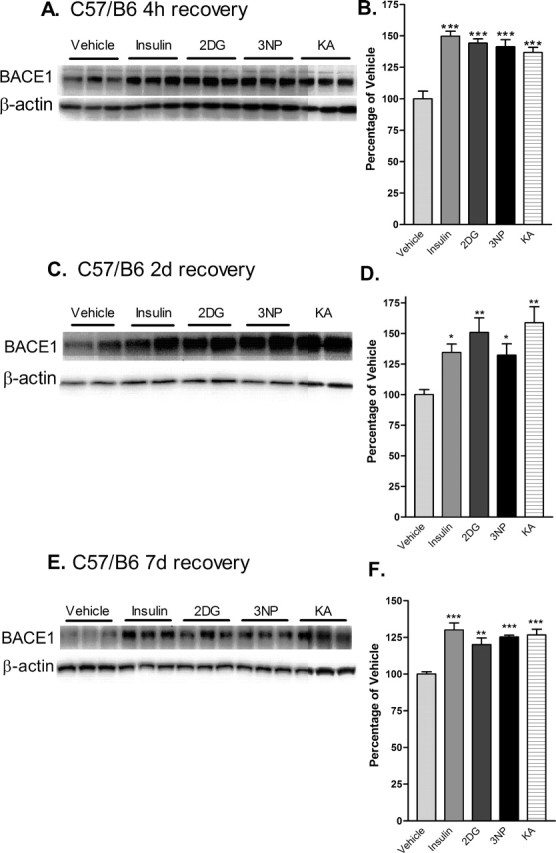
Figure 3.

Acute energy inhibition increases BACE1 protein levels in the brains of C57/B6 mice. A–F, Two- to 3-month-old C57/B6 mice were given a single intraperitoneal injection of 18 U/kg insulin, 1 g/kg 2DG, 100 mg/kg 3NP, 30 mg/kg KA, or vehicle and were then allowed to recover for 4 h (A, B), 2 d (C, D) or 7 d (E, F). Brains were then isolated and homogenized, and samples (15μg/lane) were subjected to immunoblot analysis for BACE1 protein using anti-BACE1 antibody PA1–757. Blots were stripped and reprobed with anti-β-actin antibody as a loading control. A, C, E, Representative BACE1 (top panels) and β-actin (bottom panels) immunoblots for the various treatments and recovery times are shown. B, D, F, The intensities of BACE1 band signals were quantified on a PhosphorImager (Eastman Kodak), normalized against the β-actin immunosignals for each sample, and then expressed as percentages of the mean of the vehicle control for a given recovery time. Note that the energy-inhibitor treatments elevated cerebral BACE1 protein levels to 125–150% of vehicle control values for all recovery times (*p < 0.05, **p < 0.01, and ***p < 0.001, one-way ANOVA with Newman-Keuls multiple-comparison test). A–D, Data represent mean ± SEM; n = 9 mice/treatment (A, B), n = 5 mice/treatment (C, D), and n = 4 mice/treatment (E, F).
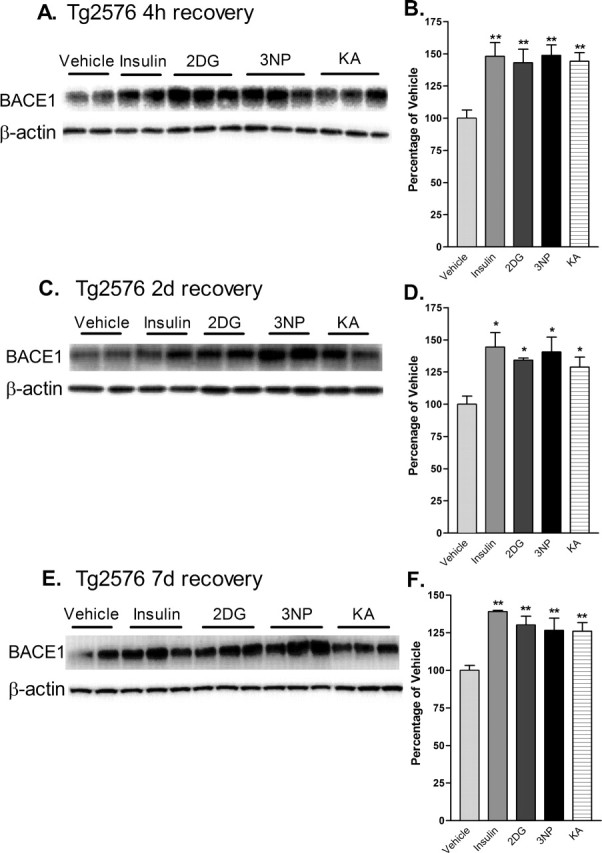
Figure 4.

Acute energy inhibition increases BACE1 protein levels in the brains of Tg2576 mice. A–F, Two- to 3-month-old Tg2576 mice were injected with 18 U/kg insulin, 1 g/kg 2DG, 100 mg/kg 3NP, 30 mg/kg KA, or vehicle and were allowed to recover for 4 h (A, B), 2 d (C, D), or 7 d (E, f). A, C, E, Representative immunoblots of brain samples for BACE1 (top panels) and β-actin (bottom panels). B, D, F, BACE1 immunosignals were quantified, normalized against β-actin signals, and expressed as percentages of vehicle controls, as before. Similar to the effects observed in C57/B6 mice, energy-inhibitor treatments in Tg2576 mice caused cerebral BACE1 levels to increase to 125–150% of vehicle controls for all recovery times (*p < 0.05 and **p < 0.01, one-way ANOVA with Newman-Keuls multiple-comparison test). Data represent mean ± SEM; n = 6 mice/treatment (A, B), and n = 4 mice/treatment (C–F).
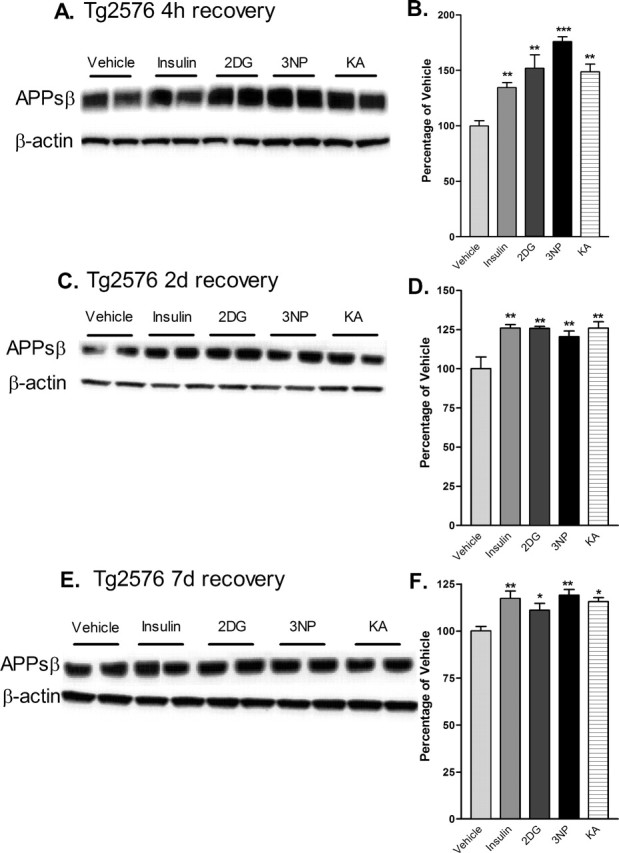
Figure 5.

Cerebral levels of APPs(sw) are elevated after acute inhibition of energy production in Tg2576 mice. Brain homogenates from Tg2576 mice treated with 18 U/kg insulin, 1 g/kg 2DG, 100 mg/kg 3NP, 30 mg/kg KA, or vehicle were subjected to immunoblot analysis using an antibody raised against the C-terminal neoepitope generated by BACE1 cleavage of APPsw, which recognizes APPsβ(sw) (Seubert et al., 1993; Vassar et al., 1999; Cole et al., 2005). A, C, E, Representative APPsβ(sw) (top panels) and β-actin (bottom panels) immunoblots of brain samples from treated Tg2576 mice. Recovery times were for 4 h (A, B), 2 d (C, D) or 7 d (E, F). B, D, F, APPsβ(sw) immunosignals were normalized against β-actin signals and expressed as percentages of vehicle controls. Note that cerebral APPsβ(sw) levels were increased to ∼125–175% of vehicle controls after 4 h of recovery from energy inhibition (B), and they continued to be significantly elevated after 2 d (D) and 7 d (F) of recovery (*p < 0.05, **p < 0.01, and ***p < 0,001, one-way ANOVA with Newman-Keuls multiple-comparison test). Data represent mean ± SEM; n = 6 mice/treatment (A, B), and n = 4 mice/treatment (C–F).


