
Figure 4.
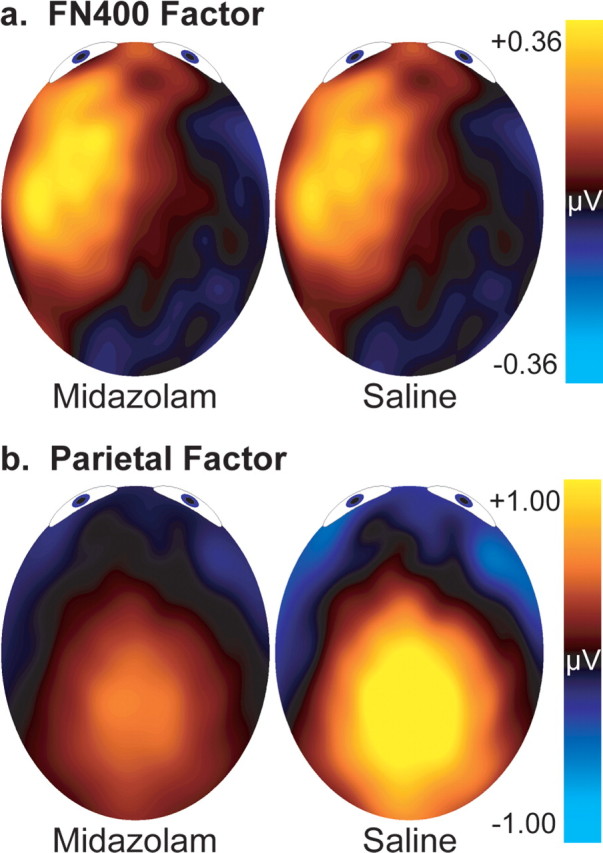
Topography of the PCA factors. The distribution of each factor is calculated by multiplying the factor loadings by the factor scores and then by the SDs for the original data. These values were averaged between 300 and 800 ms. a, FN400 factor. b, Parietal factor.