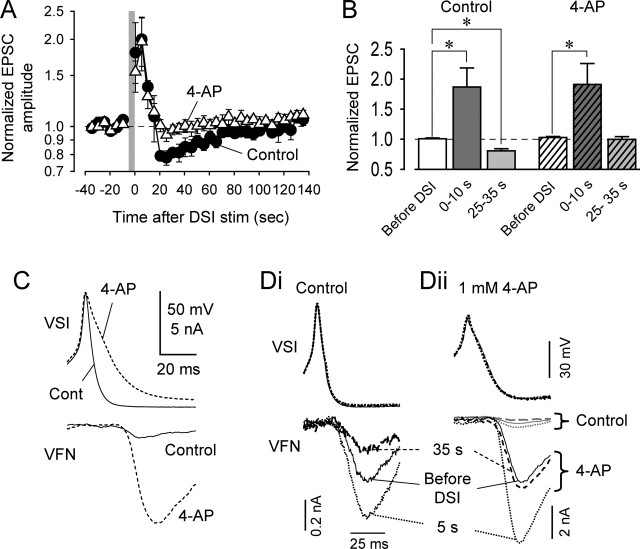
Figure 2.
The depression phase of STDN was selectively blocked by 4-AP. A, Averaged data showing the effects of DSI stimulation on normalized VSI-evoked EPSCs in control saline (filled circles) and in 1–2 mm 4-AP (opened triangles). Each plot shows a mean value (mean ± SEM) of pooled data obtained from six preparations. The gray vertical bar represents a 5 s, 10 Hz DSI spike train. B, Bar graph showing mean ± SEM of the normalized EPSC amplitudes before DSI stimulation and 0–10 and 25–35 s after DSI stimulation in control and 4-AP (1–2 mm) saline across preparations (n = 6). Statistical comparisons were made with two-way ANOVA with Fisher's LSD method. Asterisks indicate significant changes (p < 0.05). C, Overlaid traces of simultaneously recorded VSI action potentials and the resulting EPSCs in VFN. 4-AP (1 mm) (dashed lines) greatly broadened the VSI action potential and increased the size of the EPSC compared with control conditions (solid lines). Here, VSI action potentials were evoked by injecting current pulses (7 nA; 50 ms) into the soma through a second electrode. D, The potentiation phase of STDN was independent of spike broadening. Recordings were obtained before the DSI spike train (solid trace), 5 s after the DSI spike train (short dash), and 35 s after the DSI spike train (long dash) in control saline (Di) and in saline containing 1 mm 4-AP (Dii). The VFN traces in Di and Dii are normalized so that the EPSC amplitudes before DSI stimulation are comparable. In Dii, the three control traces are also shown at the same gain (gray traces). stim, Stimulation.

