
Figure 7.
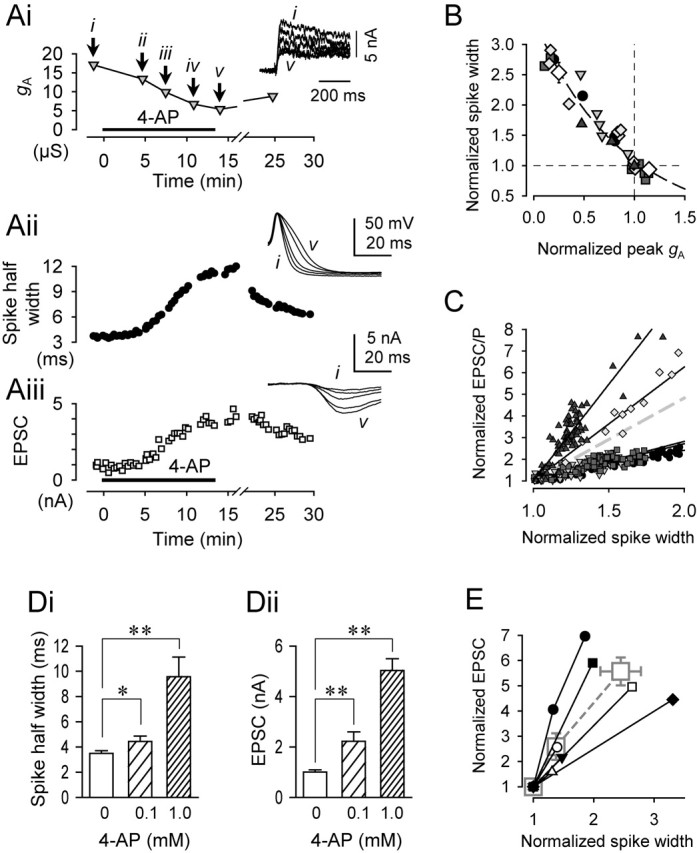
The relationship among IA, VSI spike duration, and VSI-to-VFN EPSC amplitude. A, 4-AP wash-in gradually reduced gA (Ai), increased the VSI spike half-width (Aii), and increased the amplitude of VSI-evoked EPSC (Aiii). Periodically, VSI was voltage clamped, and Vm was stepped up from −90 to −10 mV to measure IA as indicated by the arrows (i–v, top inset). While not voltage clamped, a VSI action potential (middle inset) was triggered every 20 s by the injection of a brief current pulse (10 nA; 10 ms) through a second electrode. The action potential evoked an EPSC in VFN (bottom inset). Spikes and EPSCs evoked before and after each voltage-clamp recording were averaged and overlaid in the middle and bottom insets. 4-AP (1 mm) was washed in as indicated by the horizontal bar. B, Plot of spike width as a function of normalized gA showing an inverse relationship. All data were normalized to the control values obtained before 4-AP wash-in. Data from four different preparations are fit by a single exponential curve that was constrained to pass through the point (1,1). C, Plot of the amplitudes of VSI-evoked EPSCs or EPSPs versus spike width recorded simultaneously during 4-AP wash-in. Data were normalized to an averaged control value before 4-AP wash-in. Plots are the results from five preparations, and each symbol represents data from a single preparation. Linear regression lines indicate that within each preparation, synaptic strength was linearly correlated to the spike width. The gray dashed line shows an averaged slope. D, Bar graphs of changes in the spike half-width (Di) and EPSC amplitude (Dii) in control saline (0 mm) and in the presence of 4-AP (0.1 and 1.0 mm). Asterisks indicate significant changes (*p < 0.05; **p < 0.001; one-way ANOVA with Fisher's LSD method). E, Plots of normalized changes in the spike half-width and EPSC amplitude. The values for each individual preparation are plotted separately without regard for 4-AP concentration (small symbols). Averages of the normalized EPSC amplitude and the normalized spike width measured in the control saline and in the presence of 4-AP (0.1 and 1.0 mm) are also plotted (large gray squares with dashed line).