
Figure 4.
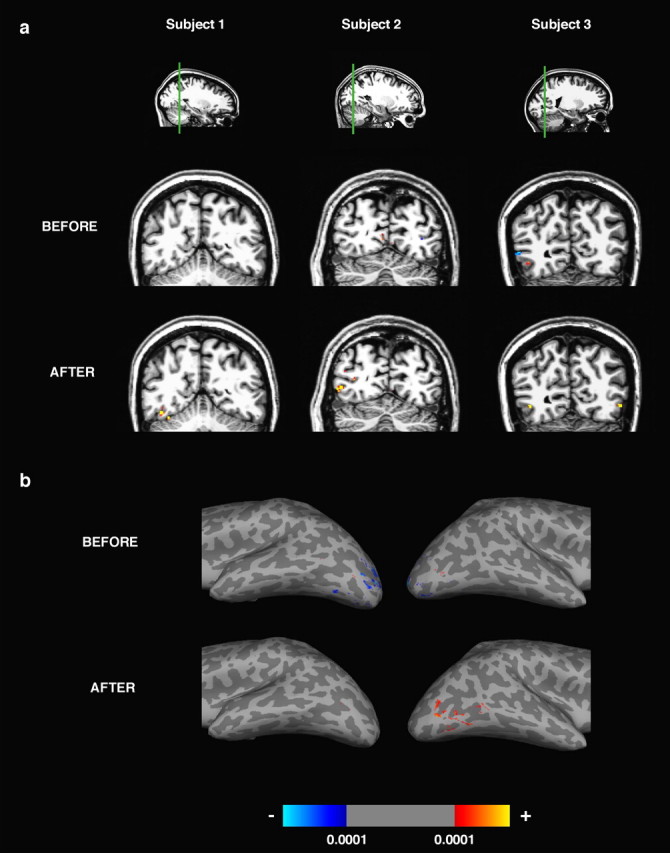
Functional activations for trained objects before and after training. Activations (significance maps thresholded at p < 0.0001, uncorrected) are shown for the contrast [trained > untrained], with red/yellow indicating positive contrast and blue indicating negative contrast. a, Functional activation overlaid on a coronal anatomical slice for three subjects. The left, middle, and right subjects were trained with the smoothies, spikies, and cubies, respectively. These subjects were representative in the size of training effects seen across the population. Slices are shown with right hemisphere at the left. b, Functional activation overlaid on a ventrolateral view of the inflated brain of a fourth subject (trained with the smoothies).