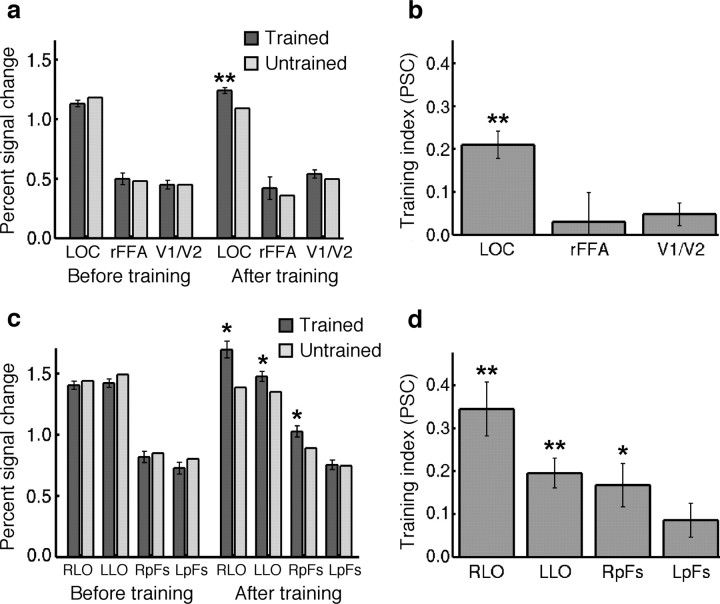
Figure 5.
Effect of training on responses (percentage signal change from fixation condition) in ROIs. a, PSC for trained and untrained object classes before and after training for three regions of interest: LOC, right FFA (rFFA), and foveal V1/V2. Error bars show the SEM across subjects of the difference in the response between trained and untrained objects. Asterisks indicate cases in which trained and untrained conditions were significantly different (*p < 0.05; **p < 0.001). b, The training index in each of these ROIs. The error bars show the SEM across subjects of the training index in each ROI. Asterisks indicate ROIs in which the training index was significantly different from zero (*p < 0.05; **p < 0.001). c, PSC for trained and untrained object classes before and after training for four subregions of LOC: right LO (RLO), left LO (LLO), right pFs (RpFs), and left pFs (LpFs). Conventions are as in a. d, The training index in each of the subregions of LOC. Conventions are as in b.

