
Figure 8.
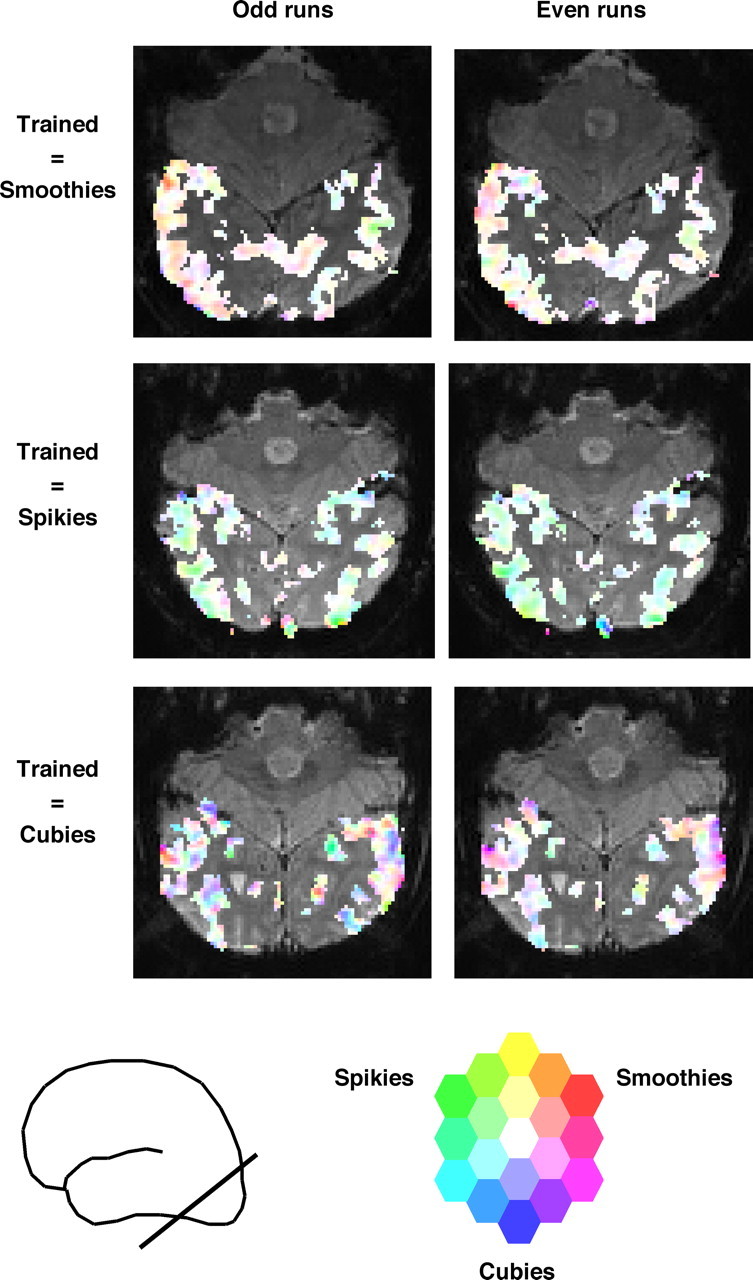
Stimulus preferences after training in odd and even runs. Stimulus preference is represented by a continuous color scale. Saturation represents the amount of selectivity (no saturation = white = same response to each object class), and hue represents which object class is preferred. This scale was applied to each voxel that was visually responsive. This color scale is overlaid on one unsmoothed functional slice in each of three subjects. The approximate position of the slices is represented by the line intersecting the brain pictogram.