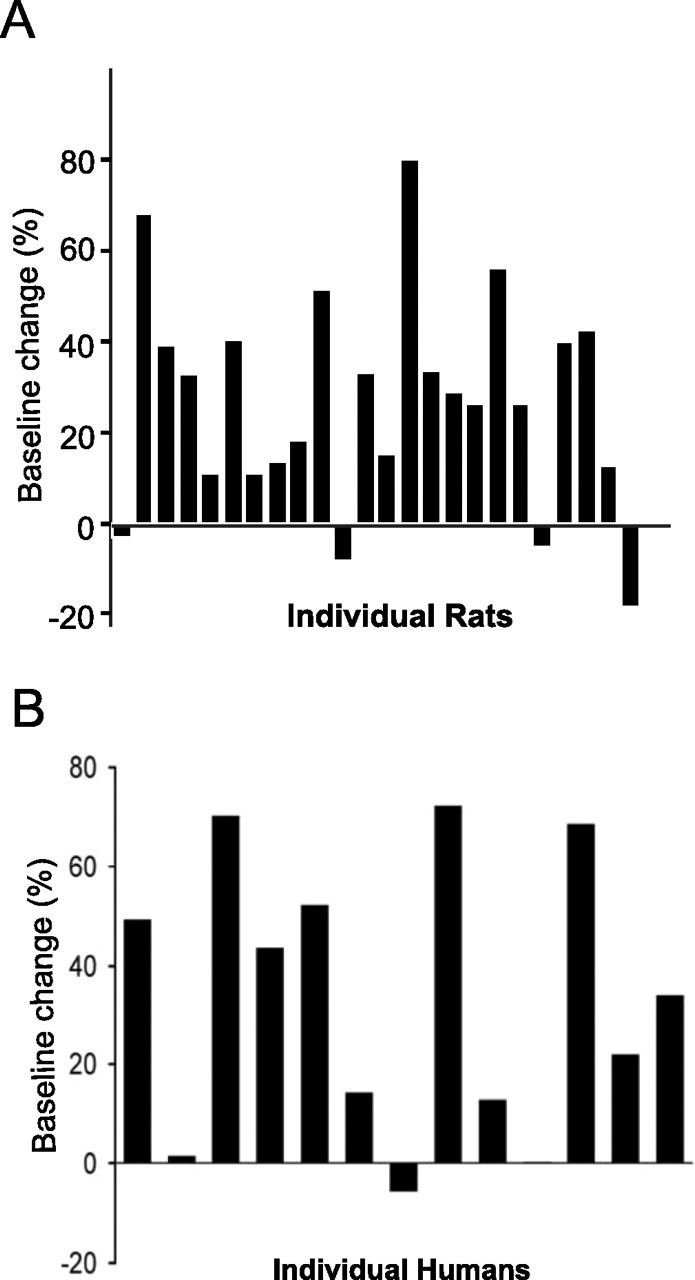
Figure 5.

Individual variability of learning-induced elevated spindle density in rats (top; data from experiment 1) and humans (bottom) after a paired-association task. Bars represent the percentage of baseline change for each individual rat or human subject. Human data are modified from Gais et al. (2002).
