
Figure 6.
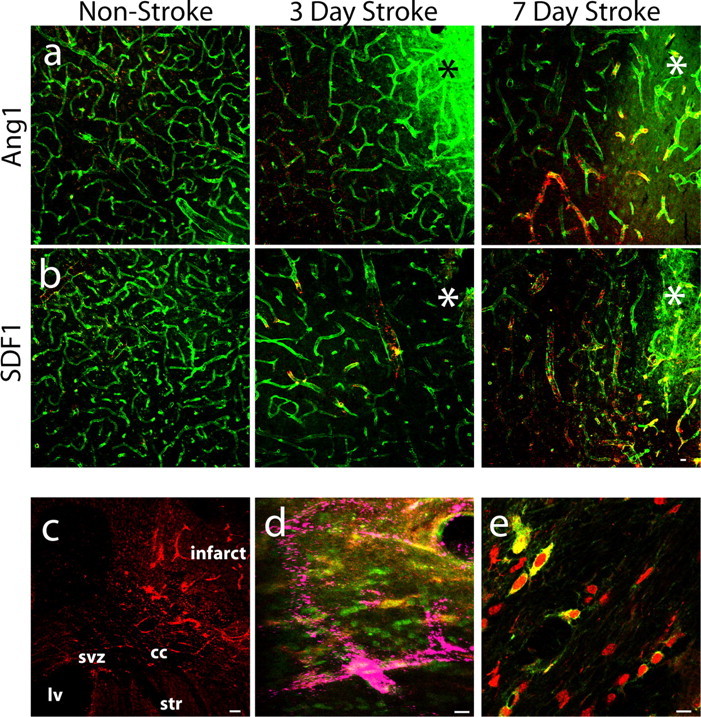
Ang1 and SDF1 are positioned to mediate post-stroke neurogenesis. a, Ang1 expression (red) in PECAM-1+ endothelial cells (green) remains unchanged at 3 d after stroke and increases at 7 d after stroke compared with non-stroke animals. Yellow indicates vessels with staining present for both PECAM-1 and Ang1. b, SDF1 expression (red) in PECAM-1+ endothelial cells (green) and overlap (yellow) increases at day 3 after stroke and persists in blood vessels through day 7 after stroke compared with non-stroke animals. Asterisks indicate the region of infarction. Scale bar, 50 μm. c, Ang1 (red) is expressed along the pathway of neuroblast migration from the SVZ toward the infarct at day 5 after stroke. Scale bar, 60 μm. d, Merged confocal images show that PSA-NCAM+ cells (red) coexpress the Tie2 receptor (green; PSA-NCAM+/Tie2+ cells are yellow) in close proximity to Ang1-expressing blood vessels (purple). Scale bar, 30 μm. e, DCX+ cells (red) colocalize with the SDF1 receptor CXCR4 (green), producing a large region of overlap (yellow), as they enter peri-infarct cortex at day 7 after stroke. Scale bar, 30 μm. cc, Corpus callosum; ctx, cortex; lv, lateral ventricle; str, striatum.