
Figure 7.
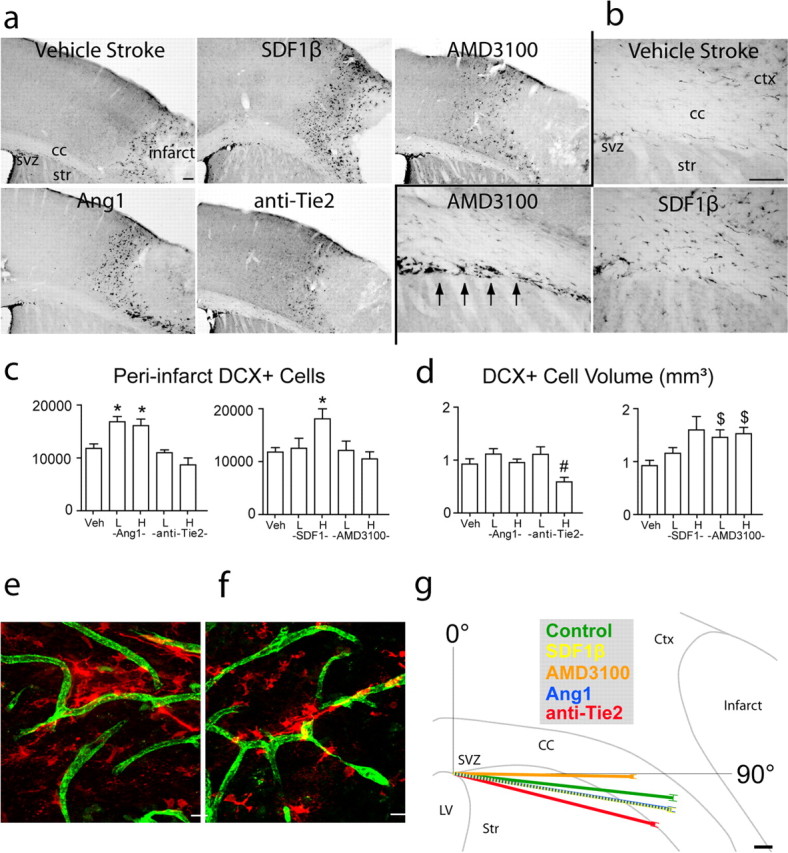
Ang1 and SDF1β gain- and loss-of-function experiments within neurovascular niche. a, DCX+ cells, stained with DAB, in peri-infarct cortex of vehicle-treated and Ang1 and SDF1β gain- and loss-of-function animals at day 7 after stroke. Scale bar, 100 μm. b, DCX+ cells in subcortical white matter of vehicle-, SDF1β-, and AMD3100-treated animals at day 7 after stroke. Arrows indicate the aberrant linear cluster of DCX+ cells along the striatum/white matter interface in AMD3100-treated stroke animals. Scale bar, 100 μm. c, Stereological quantification of DCX+ cells in peri-infarct cortex of Ang1 (left) and SDF1β (right) gain- and loss-of-function animals at day 7 after stroke. p < 0.68 after low-dose SDF1β; p = 0.04 for high-dose anti-Tie2 versus vehicle, not significant by Bonferroni's post hoc testing after Ang1. d, Volume of DCX+ cell distribution in peri-infarct cortex of Ang1 (left) and SDF1β (right) gain- and loss-of-function animals at day 7 after stroke. p < 0.01 after high-dose SDF1β; p < 0.015 for high-dose anti-Tie2 versus low dose after Ang1. For c and d, H and L indicate high and low doses, and Veh is vehicle-treated. *p < 0.016; # p < 0.015; $ p < 0.009. e, f, SDF1β (e) and Ang1 (f) treatment induce a clustering of DCX+ cells (red) around PECAM-1+ blood vessels (green). Scale bars, 25 μm. g, Summary of migration vector analysis in subcortical white matter at day 7 after stroke. The position of DCX+ cells in white matter in each treatment condition was digitized and rendered as a polar plot with a vector angle (θ) and a vector length (r). Each vector shows the mean angle and vector length of DCX+ cell migration in the indicated treatment conditions. The underlying outline is traced from a representative cresyl violet section through frontal cortex after stroke. The vector tips are bracketed by the SD for each mean. Note the vector for SDF1β is dashed to be visible as it overlaps with the Ang1 vector. The complete distribution of migratory angles is presented in histograms for each treatment condition in supplemental Figure 2 (available at www.jneurosci.org as supplemental material). Scale bar, 100 μm. Error bars in all panels indicate SD. cc, Corpus callosum; ctx, cortex; lv, lateral ventricle; str, striatum; veh, vehicle.