
Figure 10.
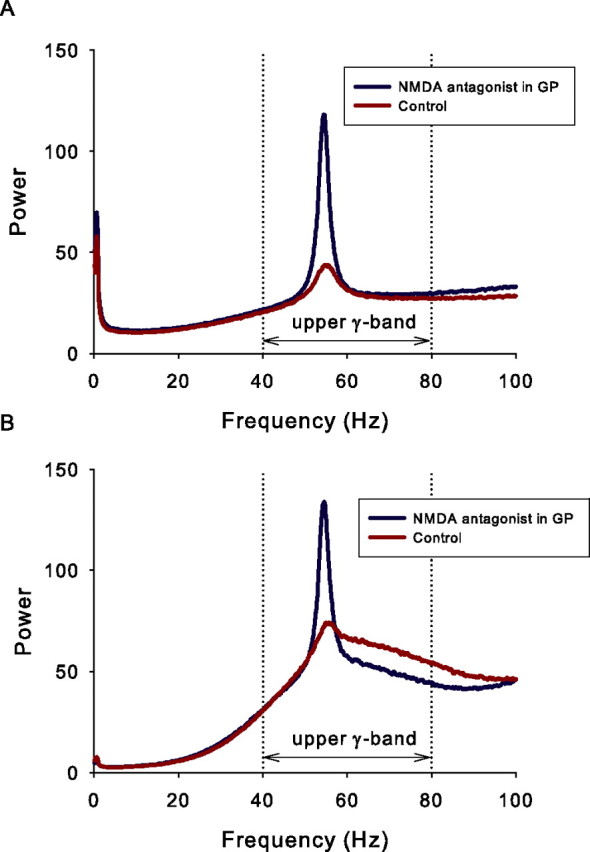
NMDA receptors mask γ-band activity. After blockade of NMDA receptors in model GP, a marked increase in power within a restricted region of the γ-band is seen in both STN and GP power spectra. A, The mean power spectrum of STN neuron output from all virtual experiments in the control condition and after NMDA receptor blockade in GP, shown by the red and blue traces, respectively. B, The corresponding mean power spectrum of all GP neurons in every virtual experiment in the control condition and after NMDA receptor blockade in GP.