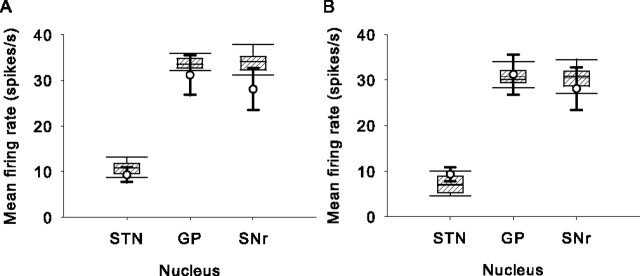
Figure 2.
Mean tonic firing rates from STN, GP, and SNr neurons in the awake resting state of the simulated and real basal ganglia. The box-and-whisker plots summarize the distribution of mean firing rates across the 50 virtual experiments. The mean firing rates from the biological experimental data (see Results) are shown by the open circles, with error bars (thick lines) showing the 95% confidence interval for each mean value. A, Model with collaterals in SNr and GP. B, Model with no collaterals in SNr and GP. Both forms of the model were able to reliably capture the respective mean firing rate properties of these nuclei in the awake rat.

