Figure 4.
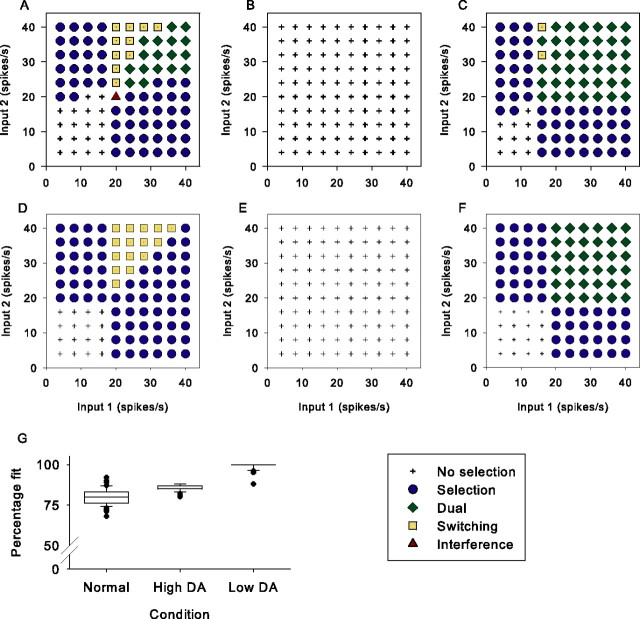
Selection and switching capabilities of the basal ganglia model. Each simulation was assigned to a category based on its combination of mean SNr outputs on channel 1 and channel 2 in response to the inputs (see Results). A, Normal levels of tonic dopamine (DA) (λD1 = λD2 = 0.3). B, Low levels of simulated dopamine (λD1 = λD2 = 0.0). C, High levels of simulated dopamine (λD1 = λD2 = 0.8). D–F, Idealized templates for selection and switching under normal, low, and high dopamine levels, respectively (see Results). G, Box-and-whisker plots of the matches between a batch of 50 models and corresponding idealized selection templates, for each level of simulated dopamine.

