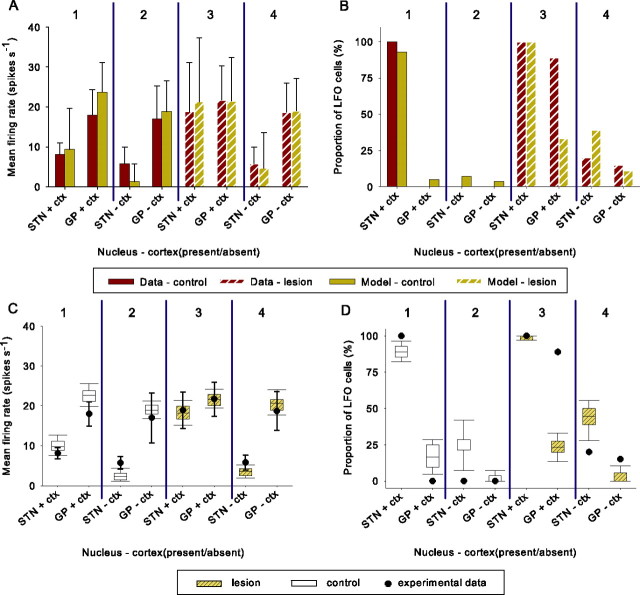
Figure 7.
Summary statistics of the response to cortical slow-wave oscillations in STN and GP across all four experimental conditions of Magill et al. (2001). Each of the experimental conditions is indicated by the numbers above the graph. Lesion results are indicated by diagonal patterned bars/boxes; ablation is indicated by “− ctx.” A, Mean firing rates; B, LFO percentages for the data and for single virtual experiments. Error bars are the SDs of the firing rate across the populations of neurons in each case. These are plotted so that distributions of the firing rates from both experimental study and virtual experiment can be compared. C, Mean firing rate; D, LFO percentage distributions for the entire batch of 50 virtual experiments compared with the experimental data. The corresponding values from the experimental data are indicated by the filled circles; for the mean firing rates, the 95% confidence interval of the mean are also shown by the thick lines (calculated from Magill et al., 2001).

