Figure 9.
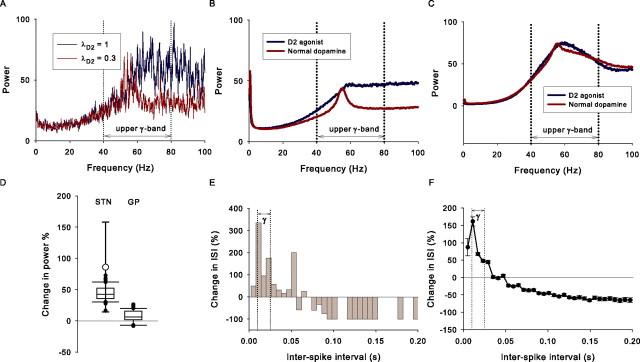
Simulated rat basal ganglia shows γ-band activity. A, The power spectrum of a single STN neuron output from a virtual experiment with normal dopamine (λD2 = 0.3) and after simulated D2 agonist injection (λD2 = 1), shown by the red and blue traces, respectively. B, The mean power spectrum of all STN neurons in every virtual experiment shows both a prominent γ-band peak in the control condition and the increase in power after simulated D2 agonist injection. C, The mean power spectrum of all GP neurons in every virtual experiment also shows a prominent γ-band peak in the control condition but no clear increase in power after simulated D2 agonist injection. D, Box-and-whisker plot showing the distribution of percentage increase in γ-band power in STN and GP after simulated D2 agonist injection across every virtual experiment. Also shown are experimental results from rat STN (Brown et al., 2002), with the mean percentage increase shown as an open circle and the 95% confidence interval by thick lines. E, Histogram of percentage change in ISIs between the control and the simulated D2 agonist application conditions for the same model STN neuron as in A. Individual ISI histograms were generated with 100 bins in the interval [0.005, 0.6] seconds. F, Mean change in ISI distribution between the control and simulated D2 agonist conditions over all sampled STN cells in every virtual experiment. Bars are ±2 SE.

