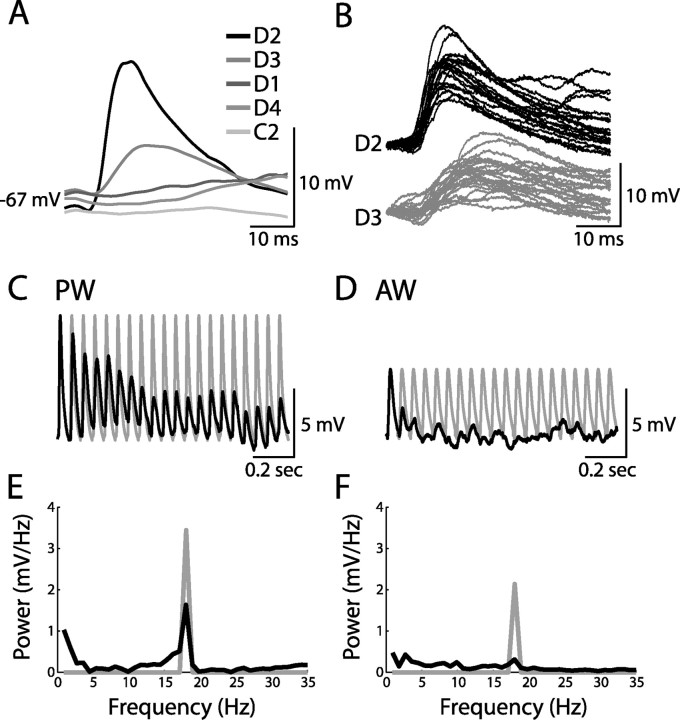
Figure 3.
Membrane potential response of a layer 4 cell to repetitive stimulation of the PW and an AW. A, Average response of the cell to stimulation of five whiskers. B, Individual responses to deflection of the PW (black) and the AW (gray). C, D, Average responses (shown in black) to repetitive stimulation (at 18 Hz) of the PW (C) and the AW (D). The averaged responses are presented together with the expected response in the absence of adaptation (a trace made from the first response and its 19 replicas, shown in gray). E, F, Absolute values of the discrete Fourier transform of the responses (black curve) together with the corresponding surrogate responses (gray curve) in C and D. These curves were used to calculate the RI as the ratio between the peak at 18 Hz and the corresponding value of the putative data.

