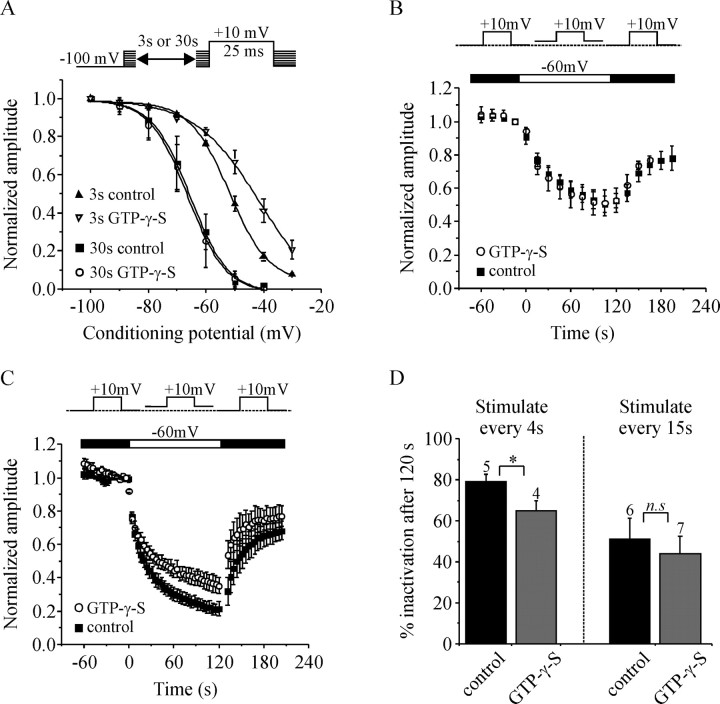
Figure 7.
G-proteins have subtle effects on closed-state inactivation of ICa. A, Plots of the voltage dependence of closed-state inactivation. Cells were recorded with Ba2+-containing extracellular solution. The top illustrates the experimental protocols. A conditioning pulse to various potentials (−100 mV to −30 mV) was applied for either 30 or 3 s before activation of IBa. Current amplitude was normalized, plotted against the potential of the conditioning pulse, and the mean data fit with a Boltzman curve. When a 30 s conditioning pulse was used, GTP-γ-S had no effect on the inactivation curve. However, when a 3 s conditioning pulse was used, GTP-γ-S significantly shifted the inactivation curve by ∼9 mV in the depolarizing direction (V1/2 = −52 ± 1 mV, n = 4 vs −43 ± 2.6 mV, n = 5; p < 0.03). B, Normalized IBa amplitude is plotted against time and the insert (above) illustrates the experimental protocol. Cells were stimulated by a 15 ms test pulse to +10 mV applied once every 15 s. Depolarizing the holding potential to −60 mV (from −100 mV or from −80 mV as shown) produced a reversible inactivation of IBa. GTP-γ-S did not significantly alter this inactivation. C, The same layout as in B except that cells were stimulated once every 4 s rather than once every 15 s. GTP-γ-S reduced the inactivation produced by changing the holding potential to −60 mV. D, Plots the mean inactivation (percent decrease in current amplitude) 120 s after changing the holding potential to −60 mV in cells stimulated once every 4 s (as in C), or once every 15 s (as B). *p < 0.04; n.s., Not statistically significant. Error bars indicate SEM.

