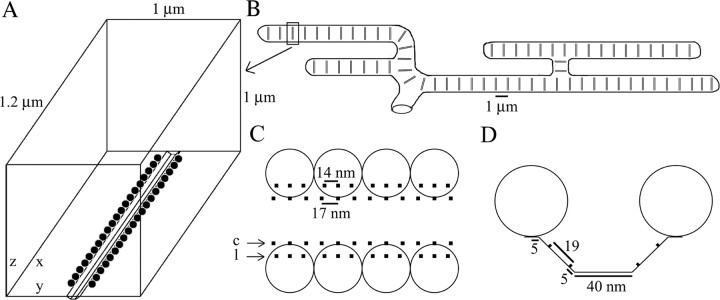
Figure 2.
Structure of frog NMJ relevant to our geometrically realistic Monte Carlo simulations. A, Simulation volume containing one AZ with associated vesicles and Ca2+ channels. B, Schematic view of a typical frog skeletal NMJ illustrating the parallel arrangement of its AZs. C, Top view (x–y plane) of part of an AZ showing the position of the two rows of vesicles and four rows of Ca2+ channels. The lateral and central rows are specified by c and l. D, Side view (y–z plane) showing the form of the valley between the rows of the vesicles and the position of the Ca2+ channels corresponding to the medial and lateral rows within the valley.

