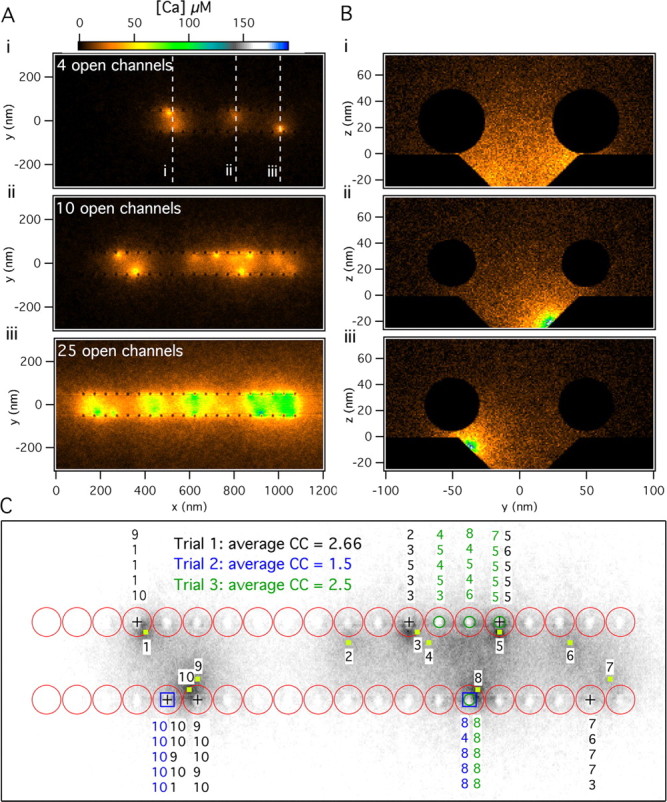
Figure 3.

[Ca2+] profiles and Ca2+ channel cooperativity. A, Standing [Ca2+] (in the x–y plane at the z = 0) (see Fig. 2A) after 4, 10, or 25 channels remained open for 1 ms. B, Standing [Ca2+] profiles (in the y–z plane) (see Fig. 2A) for three different cross sections for the four open channels condition shown in Ai. Cross section i passes through the midline of vesicles adjacent to two nearby open channels, whereas cross sections ii and iii are centered on individual channels that open in the medial and lateral rows, respectively. C, Vesicles released in response to 10 open channels as shown in Aii for three different simulation trials. The specific Ca2+ channels that contributed the Ca2+ ions that bound to the Ca2+ sensor-binding sites for release of each vesicle are indicated above or below the released vesicle. The corresponding average number of channels involved in a release event (the channel cooperativity specified by CC in the panel) for each trial is obtained directly from these data.
