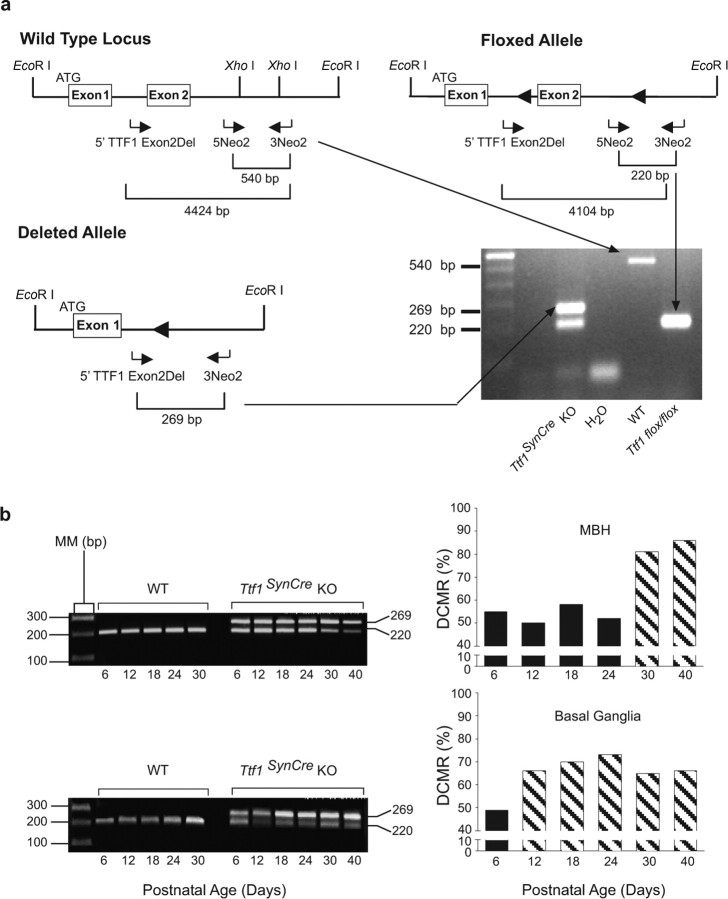
Figure 2.
PCR strategies used to genotype and calculate the DCMR in brain tissue. a, Three primers (horizontal arrows) were designed to distinguish among three possible TTF1 alleles. The wild-type allele is identified by a 540 bp PCR product amplified by primers 5Neo2 and 3Neo2. The intact floxed allele is detected by a 220 bp PCR product amplified by the same pair of primers. To estimate DCMR in different brain regions, the 5Neo2 and 3Neo2 primers were used in conjunction with a second forward primer (5′TTF1 Exon2Del). When paired with 3Neo2, this primer amplifies a 269 bp band that identifies a deleted Ttf1 allele. Although three exons have been described in the mouse genome (http://www.ensembl.org/Mus_musculus/transview?db=core&transcript=ENSMUST00000001536), we represent in the diagram only two exons, because the exact location of an exon upstream from the exon containing the main ATG (as shown in the figure) is uncertain (Lonigro et al., 1996; Oguchi and Kimura, 1998). It is also unclear whether just one or more upstream exons might be present. b, DCMR in MBH and basal ganglia. The PCR products shown on the left correspond to the floxed allele (220 bp band) and the recombined allele (269 bp band). The bar graphs on the right represent the DCMR calculated to occur in Ttf1SynCre KO mice at the indicated postnatal ages. Each bar is the mean of 2–3 animals. AU, Arbitrary units; MM, molecular marker.

