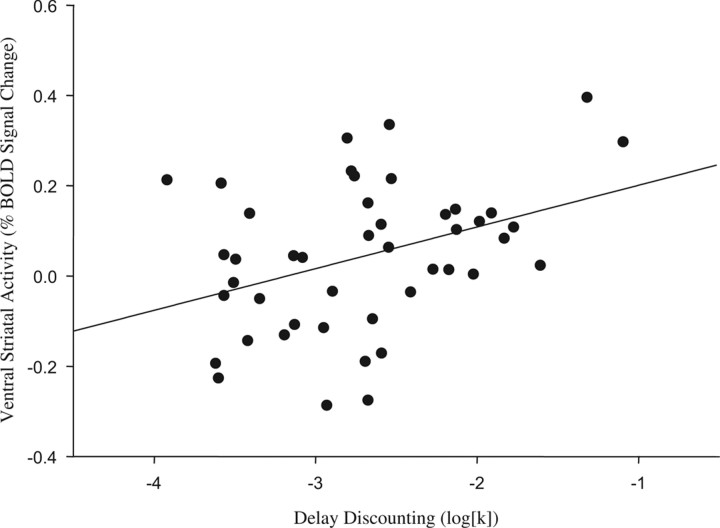
Figure 2.
Magnitude of DD is positively correlated with VS activity associated with reward sensitivity (r = 0.376; p < 0.011). The scatter plot represents the relationship between individual DD log[k] values, which index preference for smaller immediate over larger delayed rewards, and differential VS activity (right hemisphere cluster, maximal voxel coordinates: x = 8, y = 4, z = 0) from the contrast of positive > negative feedback (Fig. 1c).

