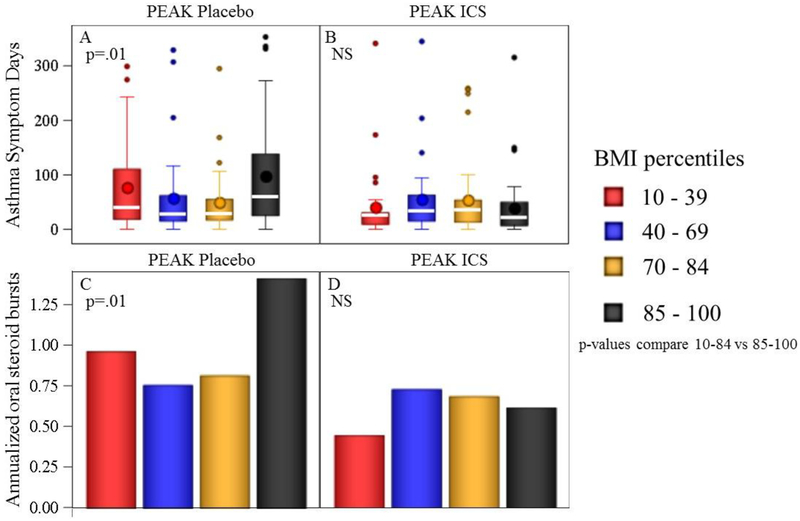
Figure 3.
Exacerbations and asthma symptom days among four BMI-percentile groups. Box plots (a, b) represent medians and intra-quartile ranges. Whiskers represent 95th% ranges. BMI-percentile grouping did not affect AD or exacerbations among ICS-treated, p>0.05; OW participants treated with placebo demonstrated significantly greater AD and exacerbations compared to NW (p=0.01 for both comparison). P-values in all panels compare BMI-percentiles 10–84 vs. 85–100.

