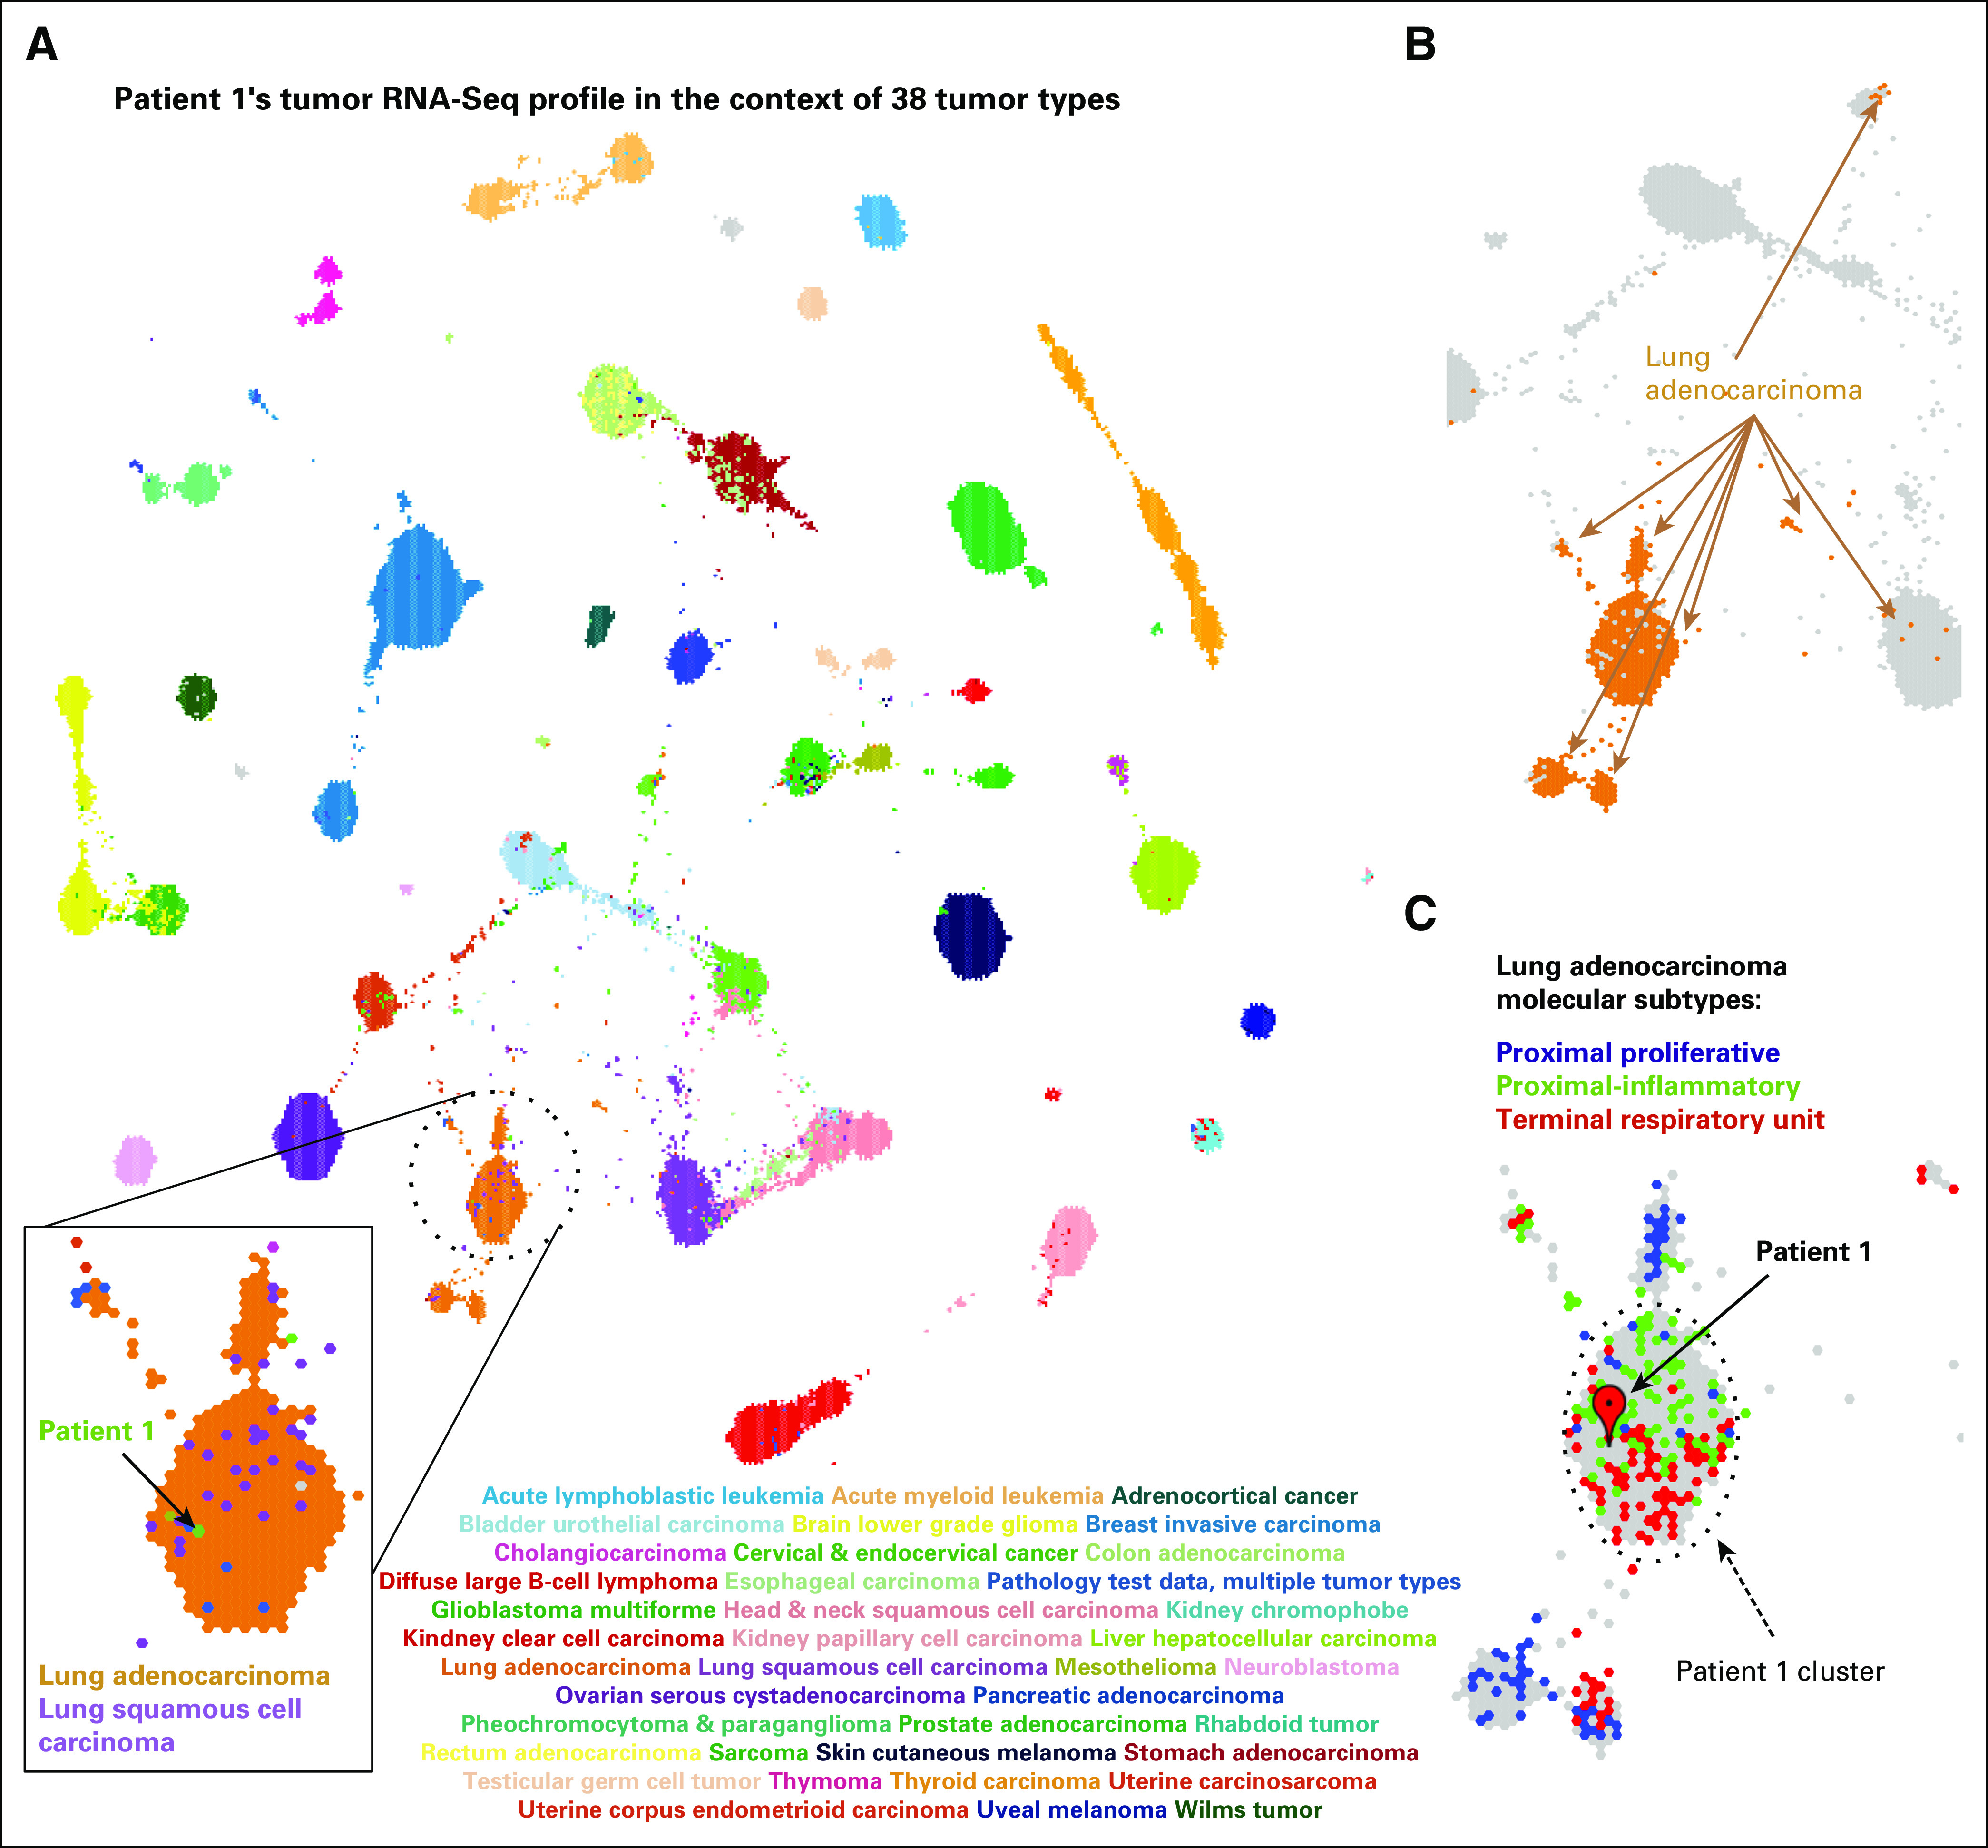
Fig 2.

RNA-Seq–based gene expression profile for patient 1 visualized in the context of the reference cohort of 38 adult and pediatric tumor types. (A) A projection of the entire tumor cohort in two dimensions according to the TumorMap method. Individual tumors are represented by hexagons, and colored tumors by the tumor type, as indicated in the graphic. The tumor in patient 1 is shown in green within the lung tumors. (B) Lung adenocarcinoma (LUAD) tumors are found in four main regions of the TumorMap visualization. LUAD tumors are depicted in orange, whereas all other tumor types are in gray. (C) A zoomed-in view of the cluster for patient 1 and the surrounding area that contains LUAD tumors, now colored according to LUAD molecular subtypes (proximal proliferative, blue; proximal inflammatory, green; terminal repiratory unit, red). Unclassified samples are colored in gray.
