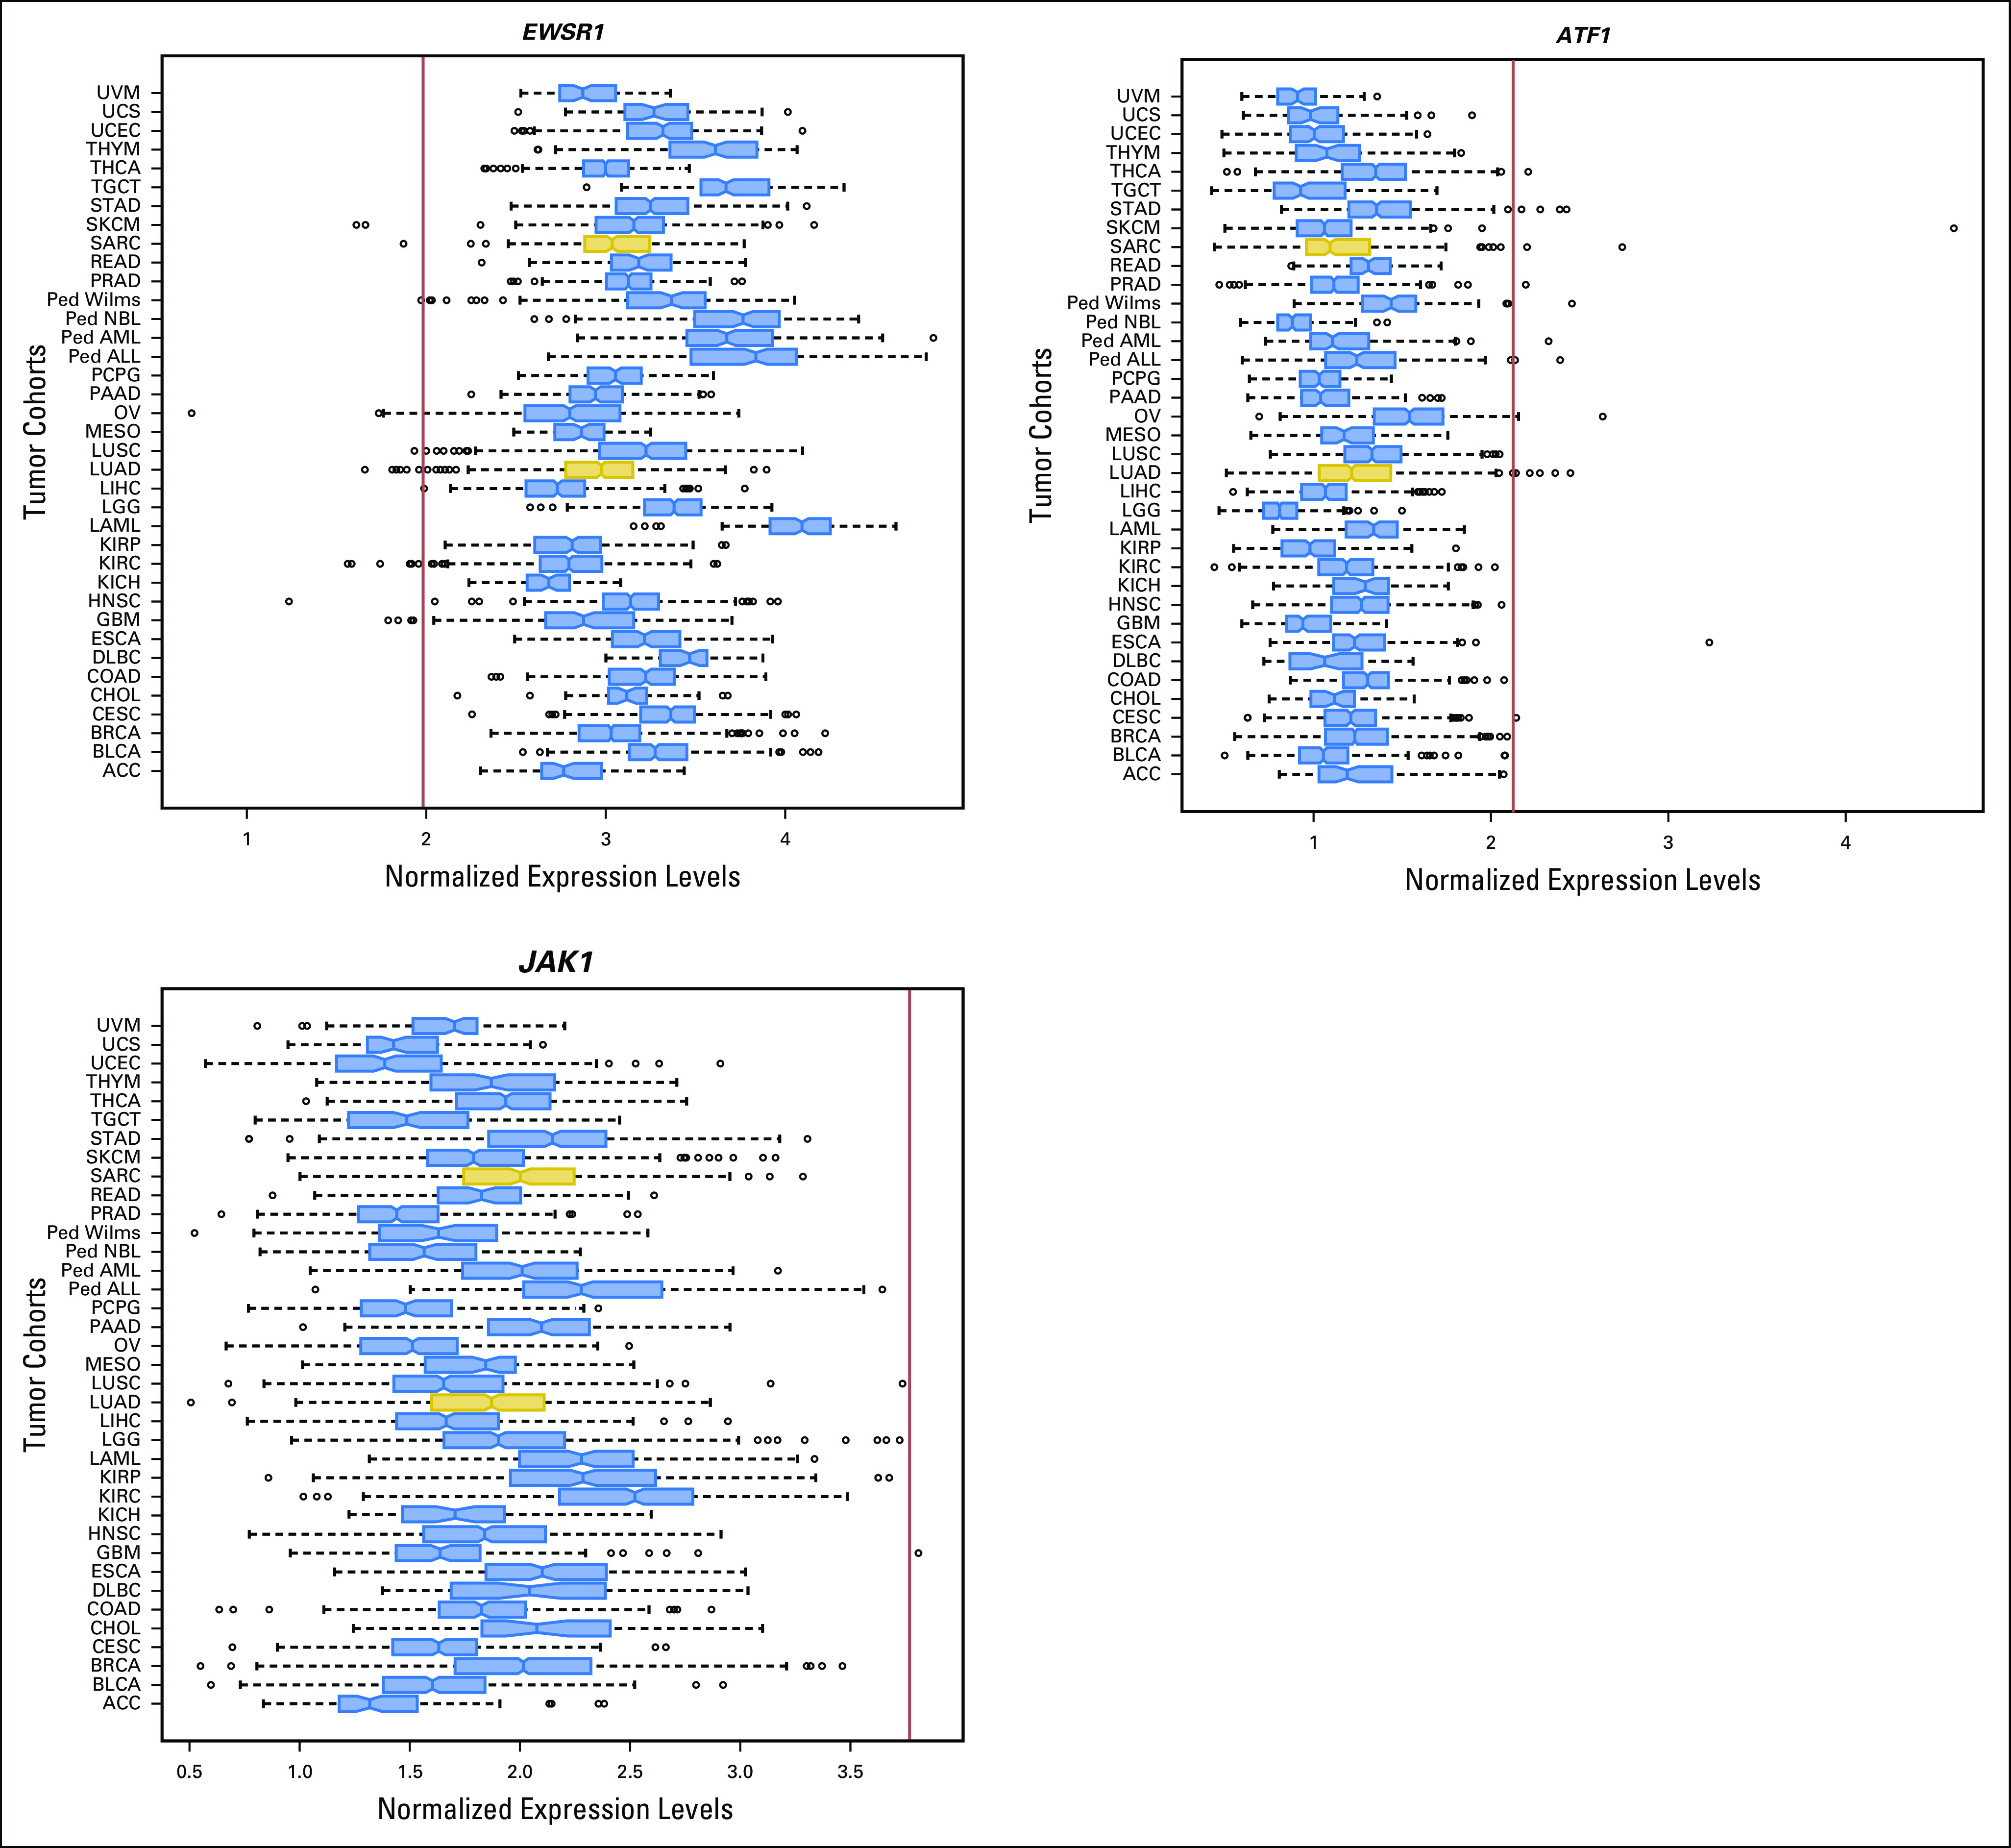
Fig A3.

Gene Set Enrichment Analysis (GSEA) of the gene scores obtained through differential gene expression analysis comparing patient 1’s TumorMap cluster to the whole reference compendium (left) and to the remaining TCGA LUAD samples (right) identifies IL6/JAK/STAT3 pathway as one of the most significantly enriched pathways in genes differentially overexpressed in patient 1’s TumorMap cluster.
