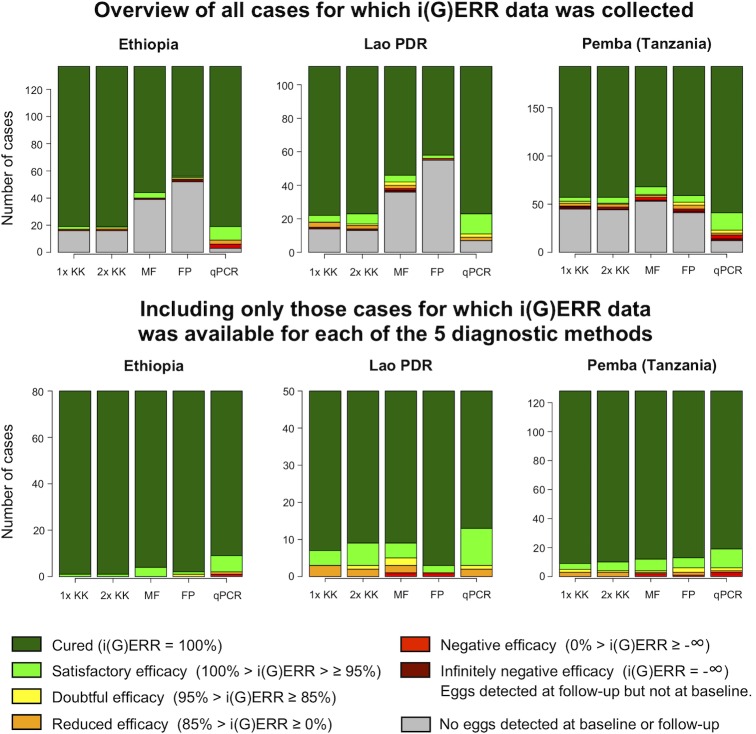
Fig 2. The individual drug efficacy of albendazole against Ascaris lumbricoides, measured by five diagnostic methods.
The upper three bar plots illustrate the different classifications of individual albendazole efficacy for A. lumbricoides detected in the study population (n = 441; Ethiopia: 137, Lao PDR: 111, Pemba (Tanzania): 193) in each of the 3 countries using 5 different diagnostic methods (single (1x KK) and duplicate Kato-Katz (2x KK), Mini-FLOTAC (MF), FECPAKG2 (FP) and qPCR). The bars represent the number of cases. The color of the bars reflects the individual egg or genome equivalent reduction rate (i(G)ERR). The bottom three bar plots represent the classification of the i(G)ERRs for A. lumbricoides for those individuals for which i(G)ERR data was available for all five diagnostic methods (n = 258; Ethiopia: 80, Lao PDR: 50, Pemba (Tanzania): 128).

