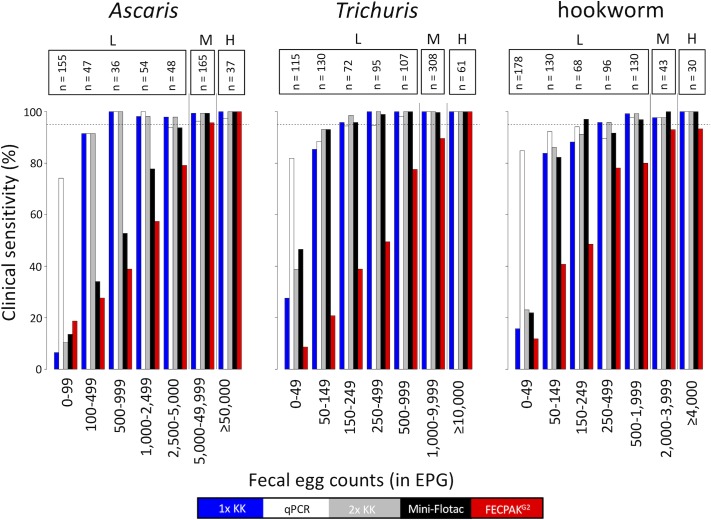
Fig 2. Clinical sensitivity of five diagnostic methods as a function of egg excretion.
The bar plots represent the clinical sensitivity of single Kato-Katz (blue), qPCR (white), duplicate Kato-Katz (grey), Mini-FLOTAC (black) and FECPAKG2 (red) across seven infection intensity categories. The range in fecal egg counts (FECs; expressed as eggs per gram of stool (EPG)) is shown on the X-axis. These FECs correspond with the highest FECs across the microscopic methods (Kato-Katz, Mini-FLOTAC and FECPAKG2). The Y-axis represent the clinical sensitivity in percentage. The number samples for each infection category (n) is shown above the bars. The WHO defined classes of infections intensities (low (L), moderate (M) and high (H)) are shown on top. The dotted horizontal line represents a clinical sensitivity of 95%.

