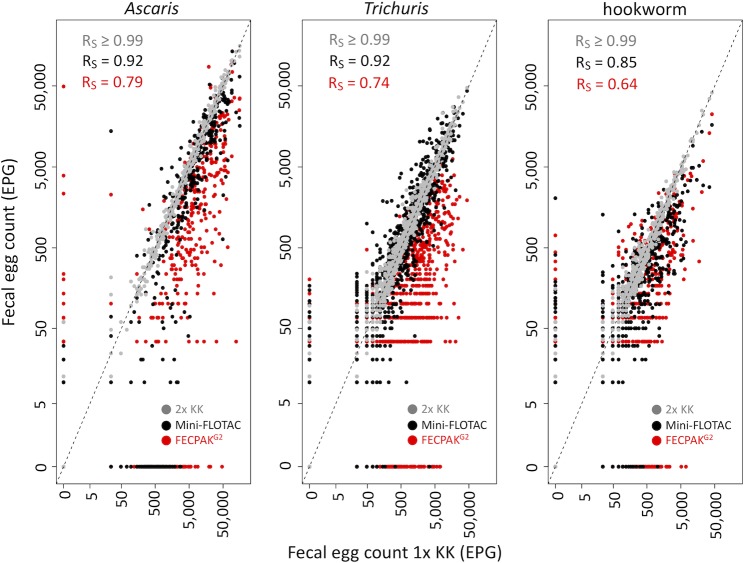
Fig 3. Agreement in fecal egg counts by the four microscopic methods.
The scatterplots illustrate the agreement in fecal egg counts (FECs, expressed in eggs per gram of stool (EPG) based on a single Kato-Katz (1x KK) with those obtained with a duplicate Kato-Katz (grey dots), Mini-FLOTAC (black dots) and FECPAKG2 (red dots) for A. lumbricoides (n = 540), T. trichiura (n = 889) and hookworm (n = 675). In each panel, the Spearman’s correlation coefficient (Rs) is given. The striped diagonal line represents the line of equivalence.

