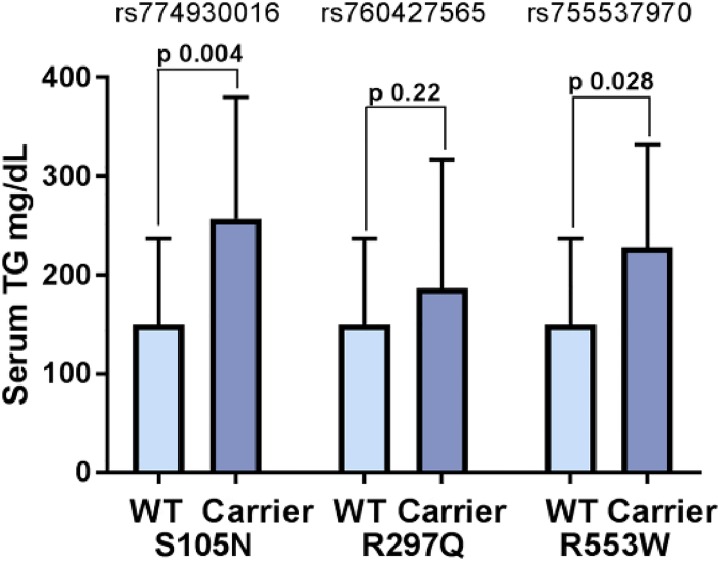
Fig 4. Serum Triglyceride mean distribution among carriers and non-carriers of missense variants.
Bar graph shows the differences in the distribution of mean serum triglycerides among carriers and non-carriers of missense mutations (S105N, R297Q, and R553W) represented by rs774930016, rs760427565, rs755537970 variants, respectively. Data are shown in mean and standard deviation of means. P values are derived from the general mixed linear models used to test the impact of genetic variants on transformed continuous trait (TG) using the variance-component test adjusted for the random-effects of relatedness and fixed effects of age, gender, BMI and type 2 diabetes. Only association of S105N would remain significant after applying Bonferroni correction.

