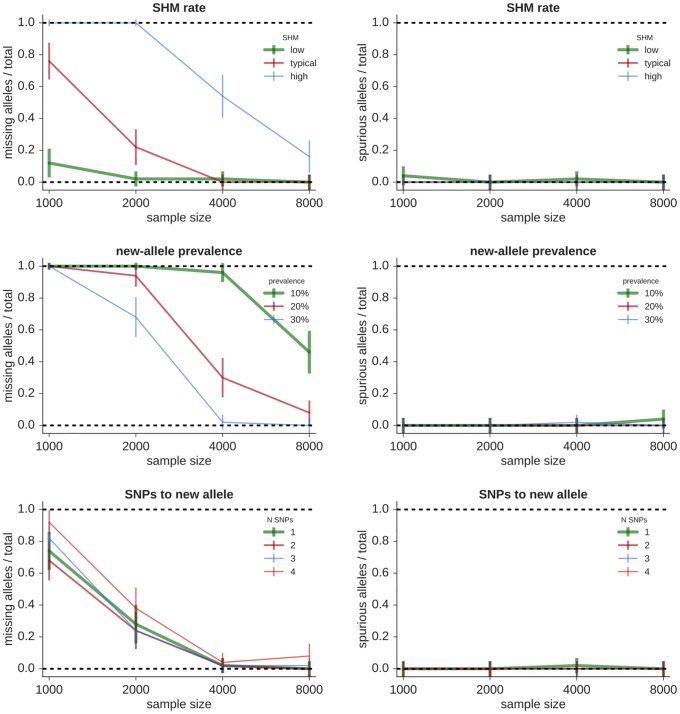
Fig 1. Fraction of true alleles missing (left) and alleles spuriously inferred (right) by partis on simplified “sparse” repertoires as a function of the number of sequences in the sample.
Each point represents the mean performance (± standard error) on 50 independent simulation samples of the indicated sample size varying the following variables. Top: SHM levels (the SHM distributions corresponding to “low”, “typical”, and “high” are shown in S1 Fig). Middle: new-allele prevalence (as a fraction of the existing allele’s prevalence). Bottom: number of SNPs (Nsnp) separating new and existing alleles.

