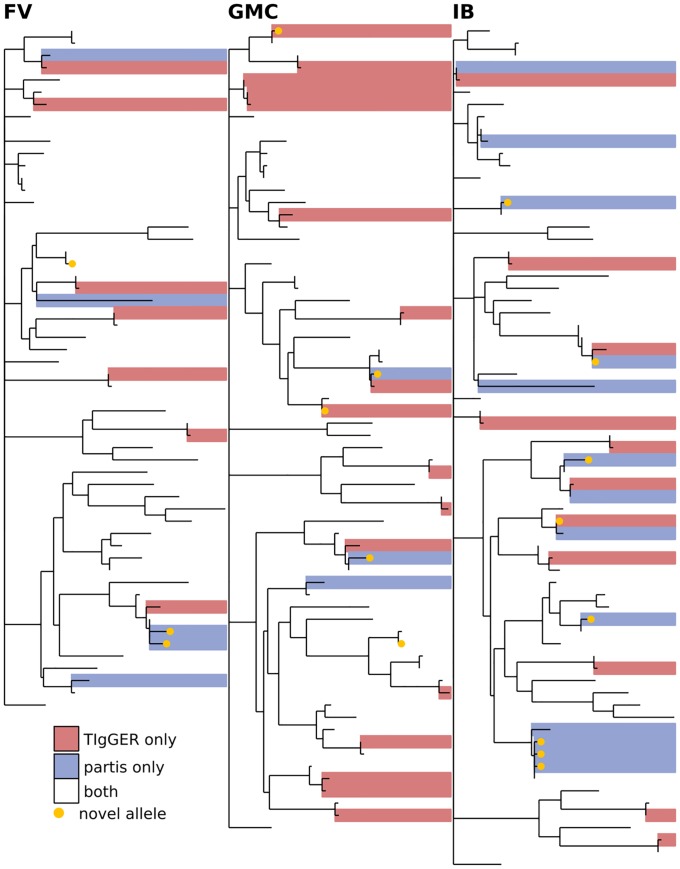
Fig 9. Comparison of germline sets inferred by partis and TIgGER for subjects FV, GMC, and IB from [35], with all ten time points merged for each subject.
The phylogenetic tree is constructed with a leaf for each germline gene that was inferred by either of the two methods. Branch lengths connecting different V gene families are set to zero. Leaves are colored according to how many methods inferred the corresponding gene: either one (red, blue) or both (white). Since this data is not IgM specific, IgDiscover is not shown. Includes the three time points in Fig 11, plus seven more, for each subject. The same trees, but with leaves labeled with gene names, are shown in S5 Fig.

